Health
Morpheus Health

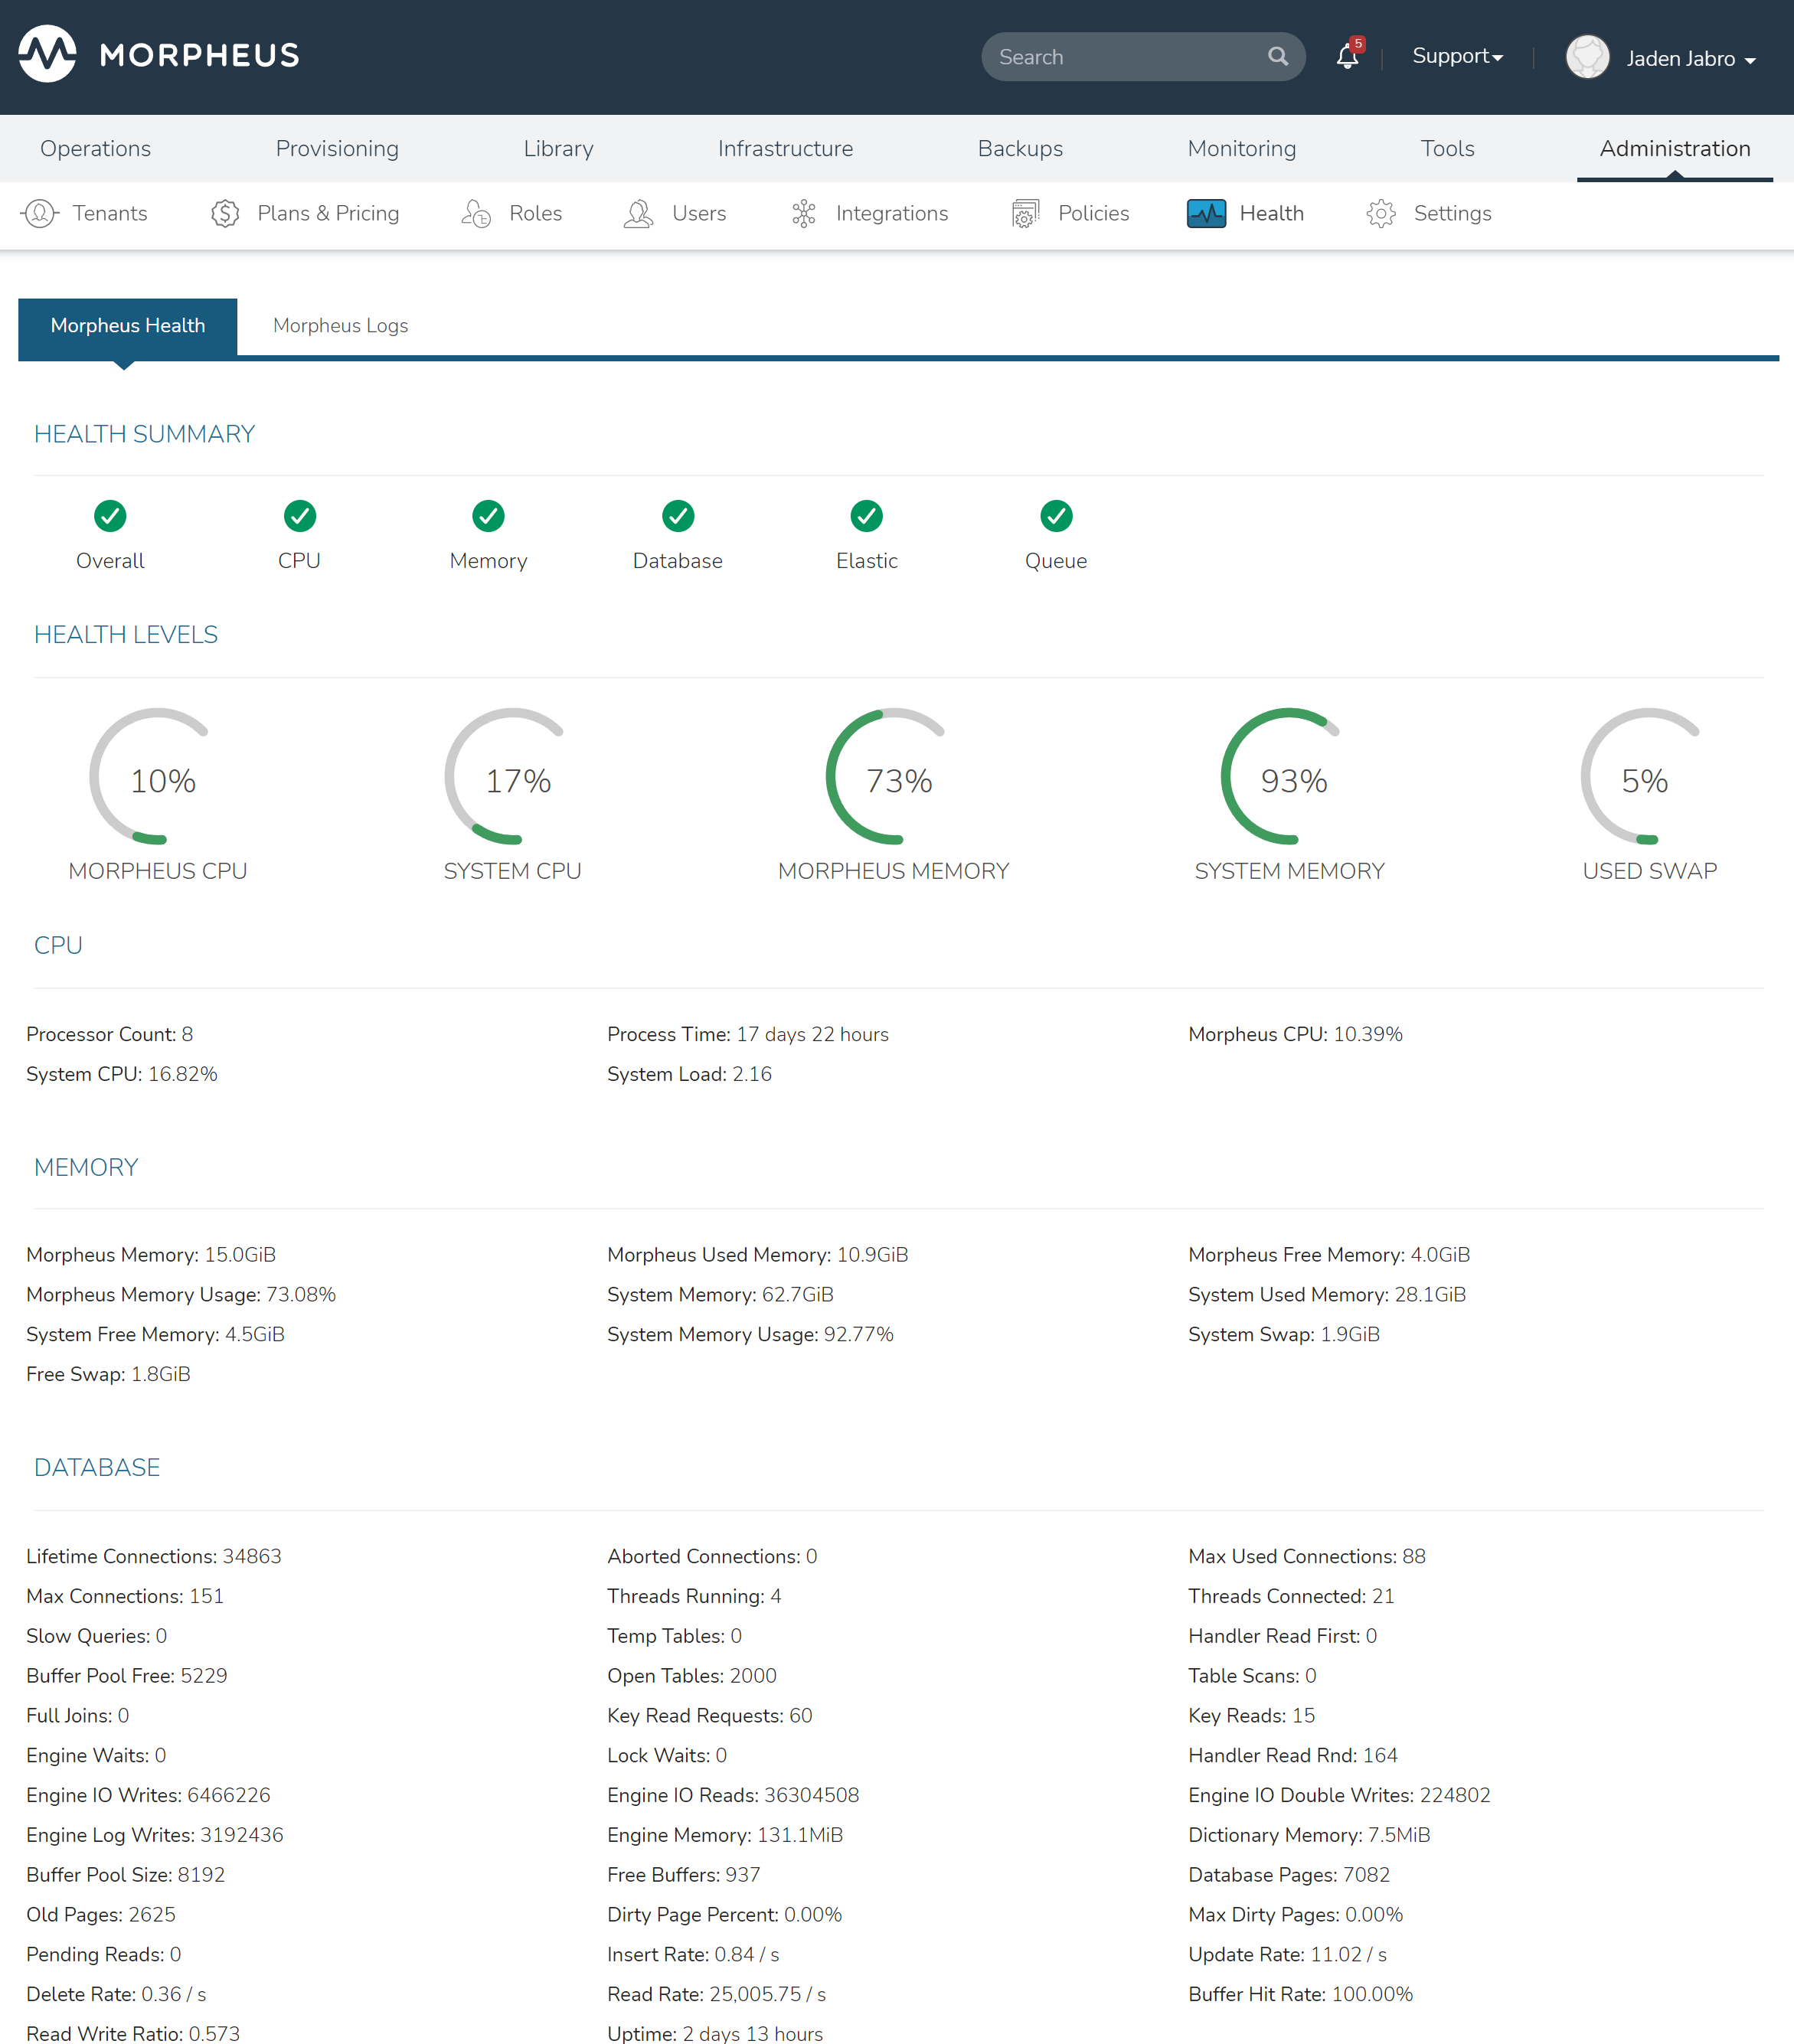
The Morpheus Health section provides an overview of the health of your Morpheus appliance. It includes an appliance health summary in the following areas:
CPU: Appliance CPU usage is checked. If usage is greater than 50%, this indicator will be in a yellow or warning state. If Morpheus is unable to complete the check, it will be in a red or error state. Depending on appliance performance and how frequently this indicator is in a warning state, it may be necessary to upgrade to increase CPU. The Overall health indicator will mirror the CPU health indicator
Memory: If swap usage is above 60% or Morpheus memory usage is above 95%, this indicator will be in a yellow or warning state. If Morpheus is unable to complete the check for any reason, it will be in a red or error state. Depending on appliance performance and how frequently this indicator is in a warning state, it may be necessary to increase swap, upgrade the appliance to add memory, or consider a different appliance architecture for those using single-node appliances
Storage: If utilization of the filesystem mounted at “/” exceeds 80%, this indicator will be in a yellow warned status. Above 90% will put this indicator in red or error status
Database: The database is checked. If the number of database connections exceeds the configured maximum number of connections or if any test queries are reported as being slow, this indicator will be in a yellow or warning state. If Morpheus is unable to communicate with the database, it will be in a red or error state. In the database section further down the page, you can check the number of maximum used connections against the number of max connections. In the case of database connections exceeding the maximum, consider increasing the maximum settings connection
Elastic: Elasticsearch is polled for the health status of each index. If any indices are not reporting a “green” health status, this indicator will be in a yellow or warning state.
Queues: RabbitMQ queues are checked. Any queues containing more than 1000 messages are considered to be in an error state. Appliance Queue health is given in a yellow or warning status when any queues are in such an error state. In the Queues section further down the page you can see the individual Queues listed and which have messages piling up. When the appliance is unable to complete the check for any reason, this indicator will be in a red or error state
Health Levels
Health levels provide a live representation of the current memory and CPU load on the appliance. Bear in mind that in an HA appliance, this data will be specific to the appliance node you happen to be using. By default, Morpheus does not include any endpoint or UI tool which can show you the currently used app node. However, a plugin has been developed which can surface this information if needed. See this thread in the Morpheus official forums for additional details about accessing and using the plugin.
Morpheus CPU: Instantaneous amount of CPU capacity in use by Morpheus processes
System CPU: Instantaneous amount of CPU capacity in use by all processes
Morpheus Memory: Instantaneous amount of system memory currently in use by Morpheus processes (see the Knowledge Base article linked in the TIP box below for more information on how Morpheus claims and manages available memory)
System Memory: Instantaneous amount of total system memory currently claimed (this is commonly a high percentage, see the TIP box below)
Used Swap: Instantaneous amount of total available system swap in use
Storage: The instantaneous percentage utilization of the filesystem mounted at “/”
Tip
It’s common to see a high percentage of system memory being used due to the way Morpheus allocates and manages memory. If Morpheus is performing well, high system memory use is not necessarily an indicator that any action needs to be taken.
Additional System Health Indices
- CPU
Processor Count
Process Time
Morpheus CPU
System CPU
System Load
- MEMORY
Morpheus Memory
Morpheus Used Memory
Morpheus Free Memory
Morpheus Memory Usage
System Memory
System Used Memory
System Free Memory
System Memory Usage
System Swap
Free Swap
- DATABASE
Version
Lifetime Connections
Aborted Connections
Max Used Connections
Max Connections
Threads Running
Threads Connected
Slow Queries
Temp Tables
Key Reads
Handler Reads
Buffer Pool Free
Open Tables
Table Scans
Full Joins
Key Read Requests
Key Reads
Engine Waits
Lock Waits
Handler Reads
Engine IO Writes
Engine IO Reads
Engine IO Double Writes
Engine Log Writes
Engine Memory
Dictionary Memory
Buffer Pool Size
Free Buffers
Database Pages
Old Pages
Dirty Page Percent
Max Dirty Pages
Pending Reads
Insert Rate
Update Rate
Delete Rate
Read Rate
Buffer Hit Rate
Read Write Ratio
Uptime
- ELASTIC
Status
Cluster
Node Count
Data Nodes
Shards
Primary Shards
Relocating Shards
Initializing
Unassigned
Pending Tasks
Active Shards
Note
Warning status is typical for Elasticsearch
- Elastic Nodes
Node
Master
Location
Heap Usage
Memory Usage
CPU Usage
1M Load
5M Load
15M Load
- Elastic Indices
Health
Index
Status
Primary
Replicas
Doc
Count
Primary
Size
Total Size
- Queues
Queue Count
Busy Queues
Error Queues
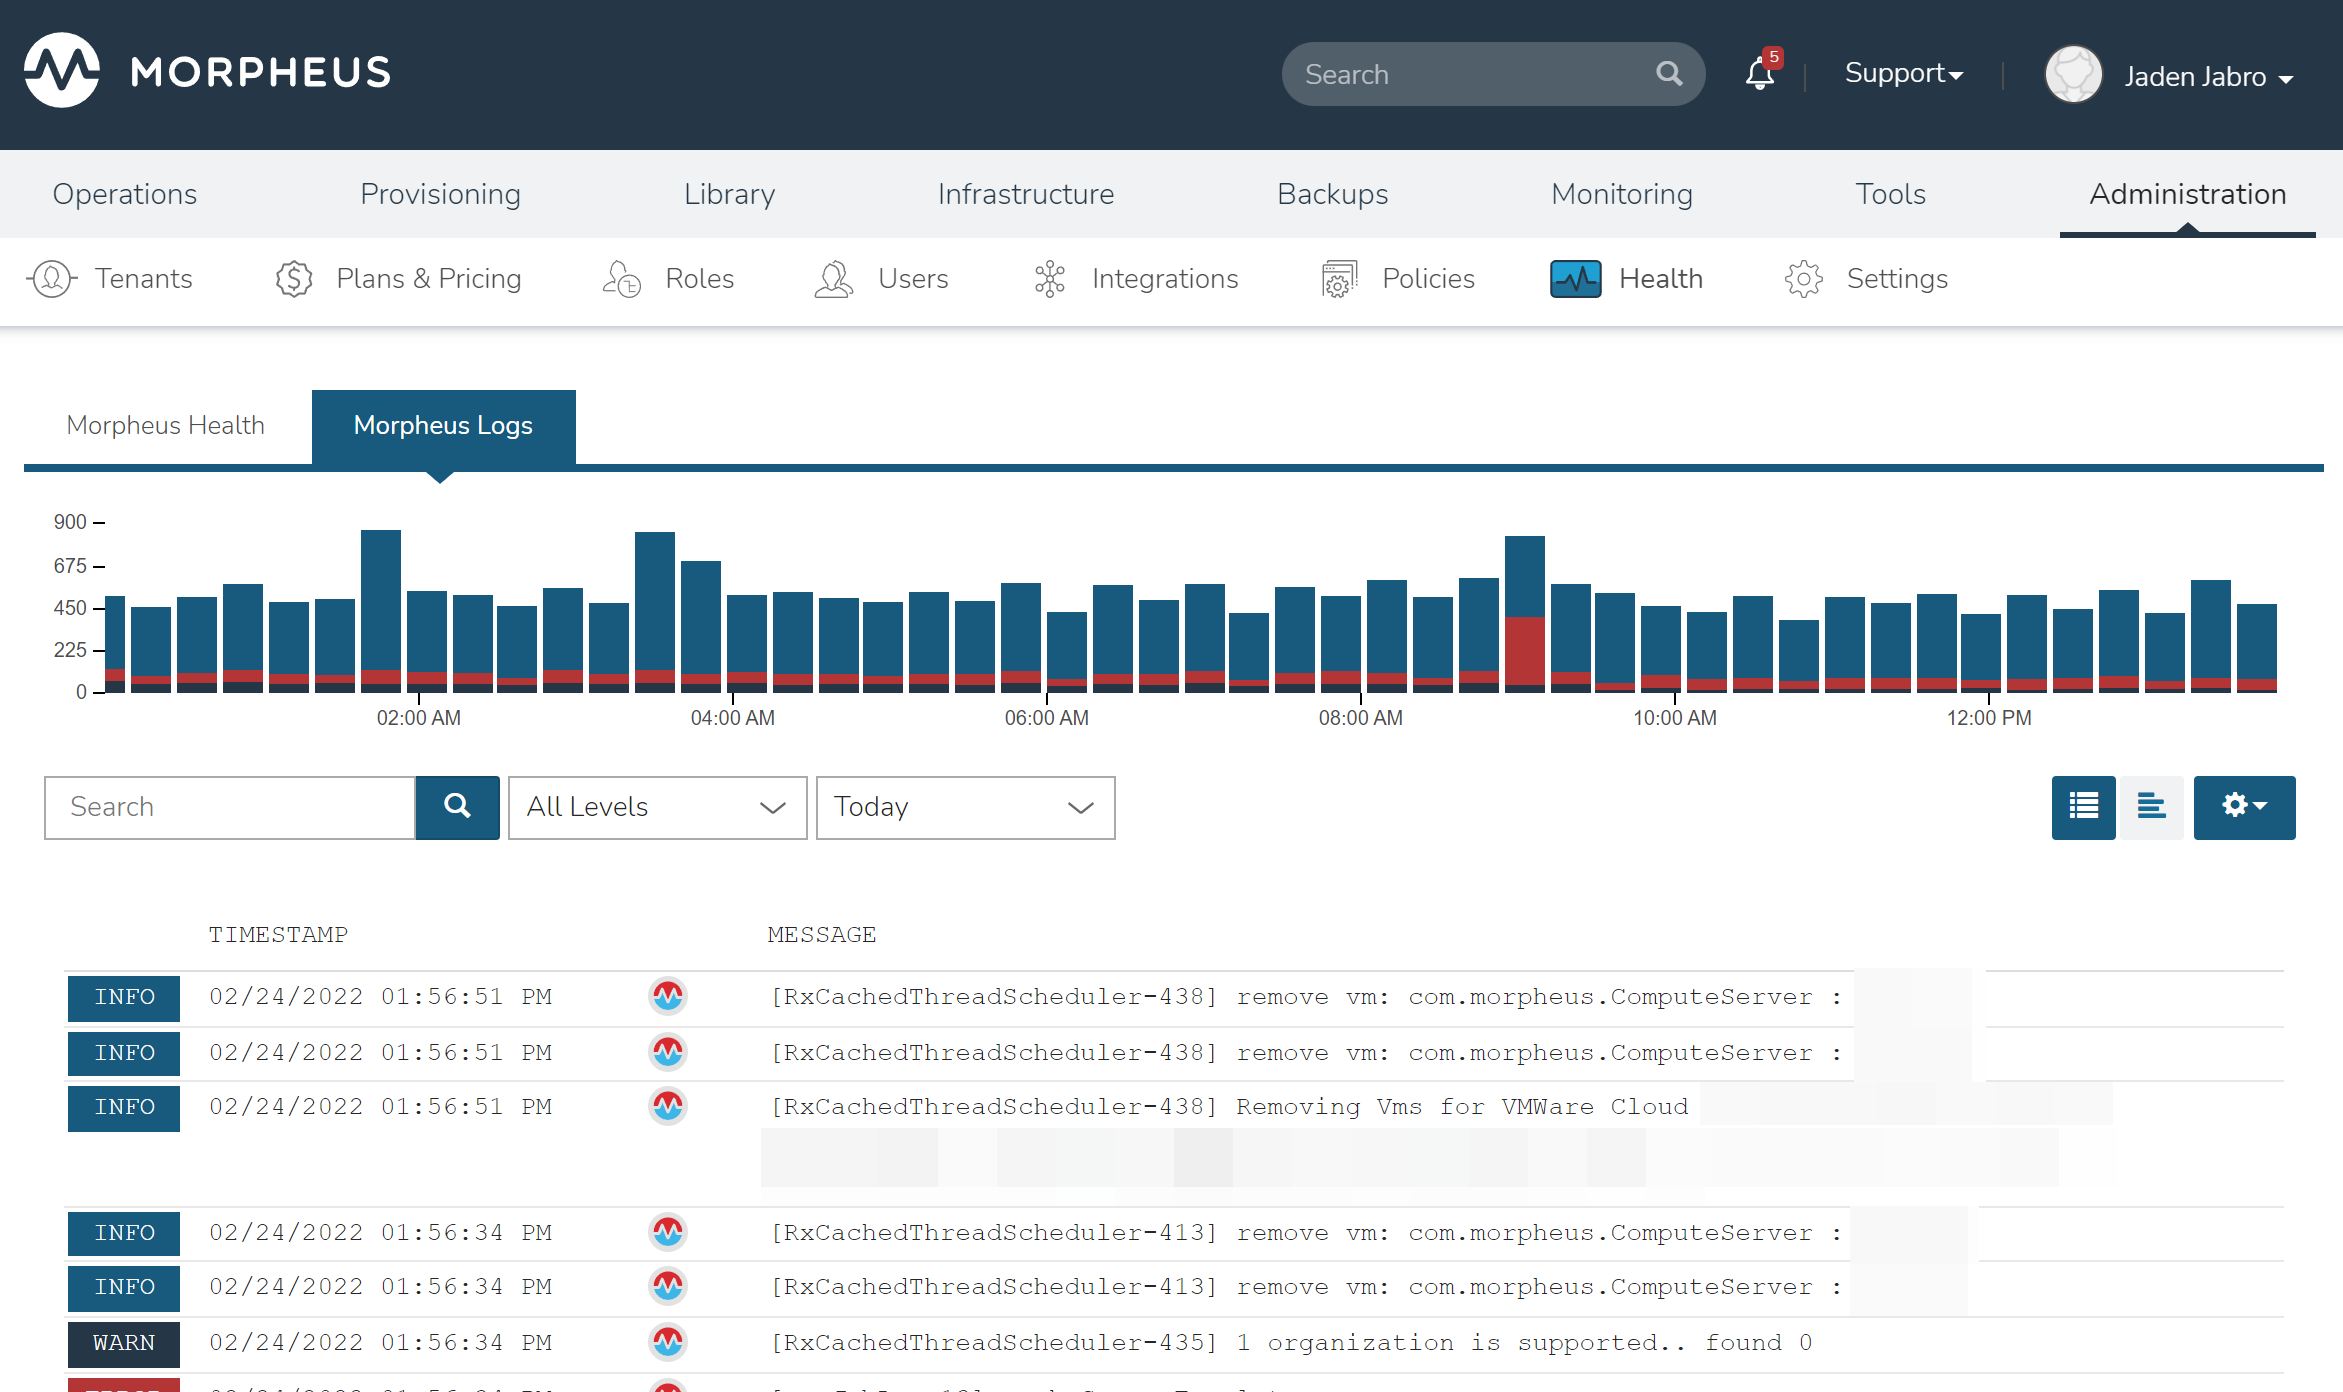
Morpheus Logs
The Morpheus logs section aggregates appliance-specific logs into one list. If needed, users can export the logs by clicking EXPORT. This action triggers a download containing the last 10,000 log entries as a .log file.
