Analytics
Overview
The Morpheus Analytics engine gives administrators the tools to break down costs and usage, then filter the results by relevant delineations including Groups, Clouds, Tenants or even tag values. Analytics dashboards can be organized into three primary categories based on their measurement intentions: costing, utilization, and workloads. Each dashboard type is discussed in further detail below.
Costing: Cloud Costing
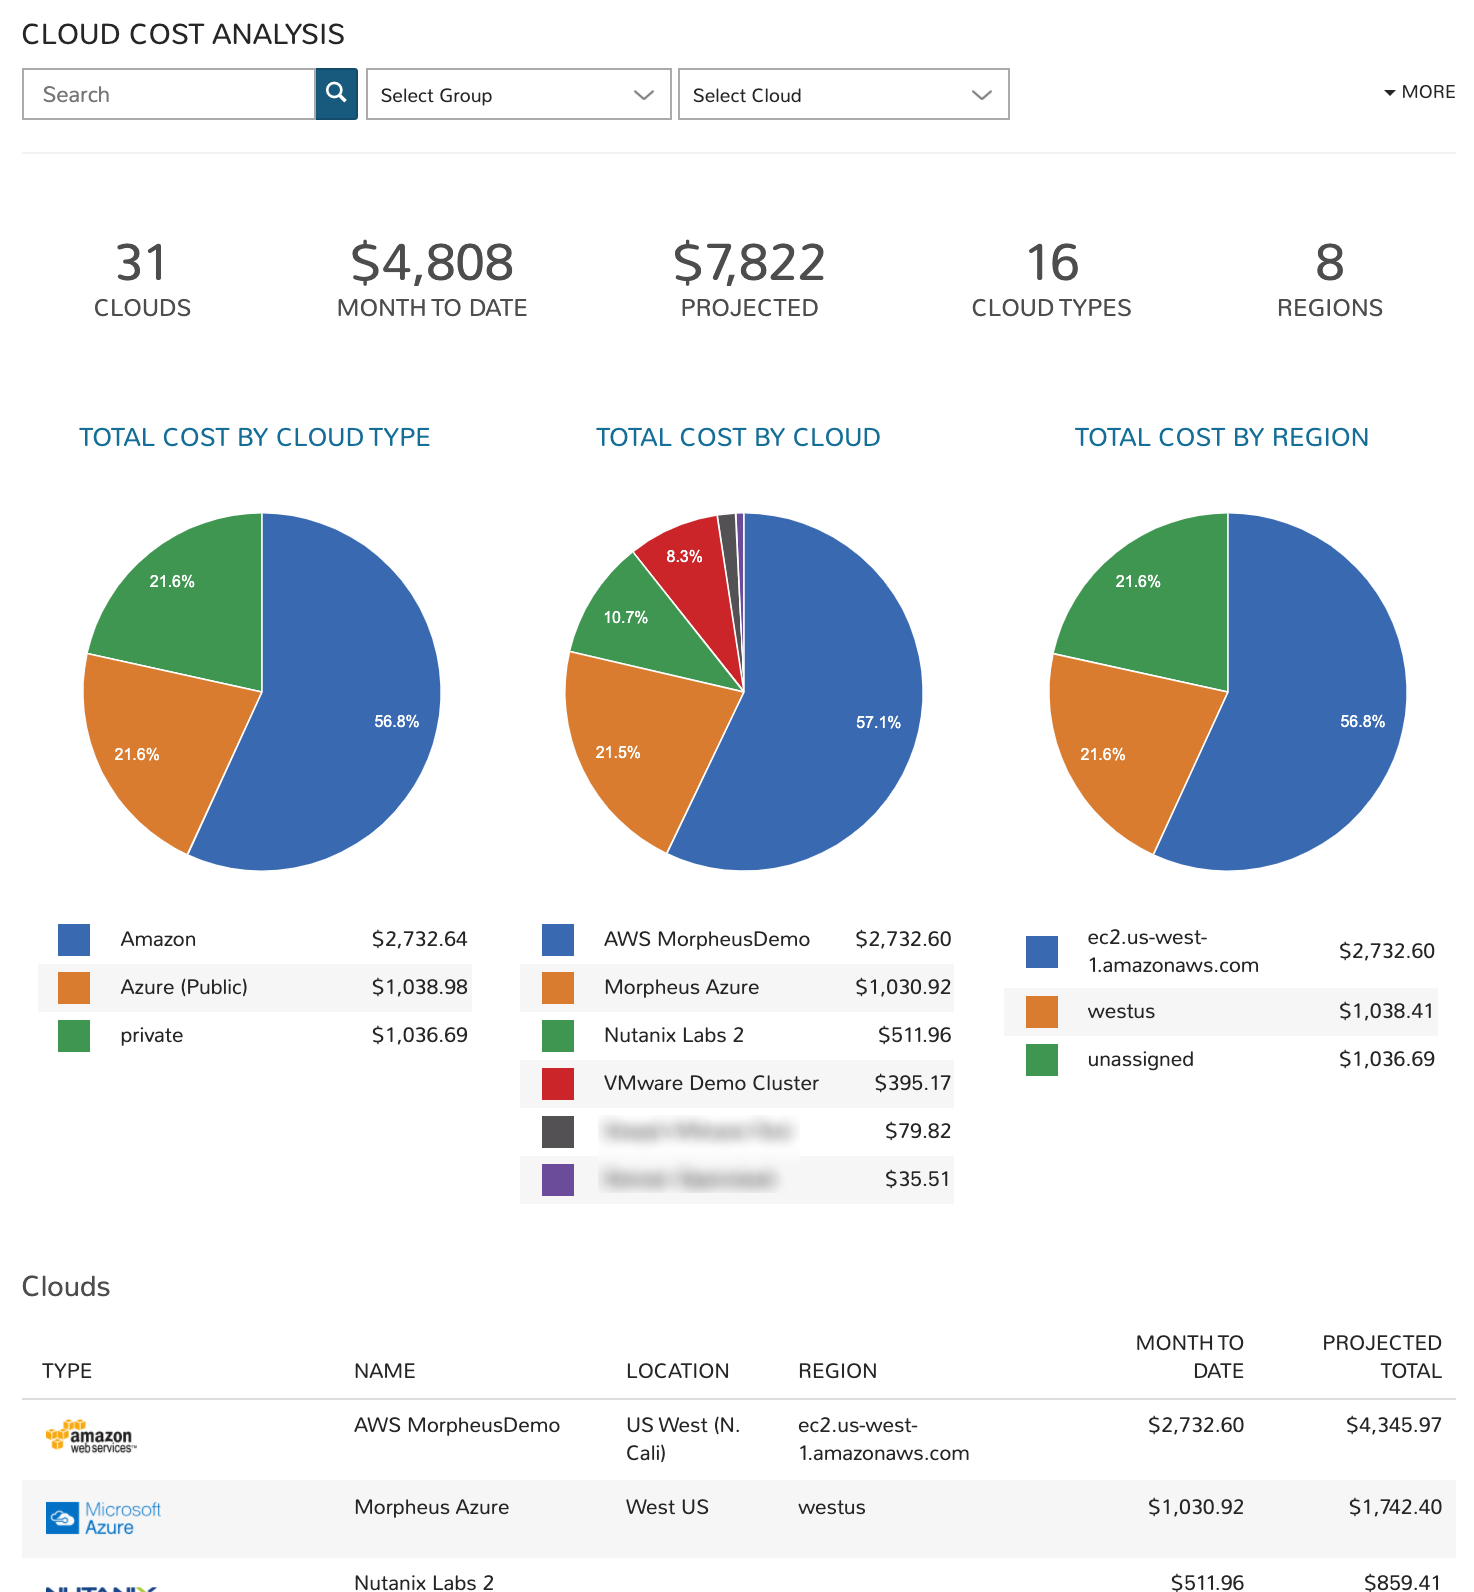
The Cloud Costing dashboard breaks down total costs by cloud type, cloud region, and individual cloud. This includes reporting the total number of clouds that meet your filters, the month-to-date running total, the projected monthly spend, among other useful metrics.
Filters
Filter the Clouds pulled into the dashboard by one or more of the following fields:
Cloud (all matched by search)
Group
Cloud (selected from dropdown)
Tenant
Tag (Key)
Value (tag value)
Data Displayed
The following aggregate totals are compiled for all Clouds that meet set filters:
CLOUDS: The total number of Clouds that meet set filters
MONTH TO DATE: The total spend in the current month for all Clouds meeting dashboard filters
PROJECTED: The projected total spend for the current month for all Clouds meeting dashboard filters
CLOUD TYPES: The number of distinct cloud types that meet the dashboard filters, such as Amazon AWS, Microsoft Azure, VMware, or any other Morpheus-supported Cloud types
REGIONS: The total number of regions represented by Clouds meeting the dashboard filters
In addition to the totals described above, graphs visualize the percentage of these totals accounted for by specific Clouds, Cloud types, and Cloud regions.
Cloud List
Each Cloud that meets set filters is listed at the bottom of the dashboard, the following data points are revealed for each individual Cloud:
TYPE: The Cloud type, such as Amazon AWS, Microsoft Azure, VMware, or any other Morpheus-supported Cloud type
NAME: The name given to the Cloud in Morpheus at the time of integration
LOCATION: The Cloud location (if available)
REGION: The Cloud region (if available)
MONTH TO DATE: The current month-to-date spend for the individual Cloud listed
PROJECTED TOTAL: The projected total spend for the current month for the individual Cloud listed
Costing: Group Costing
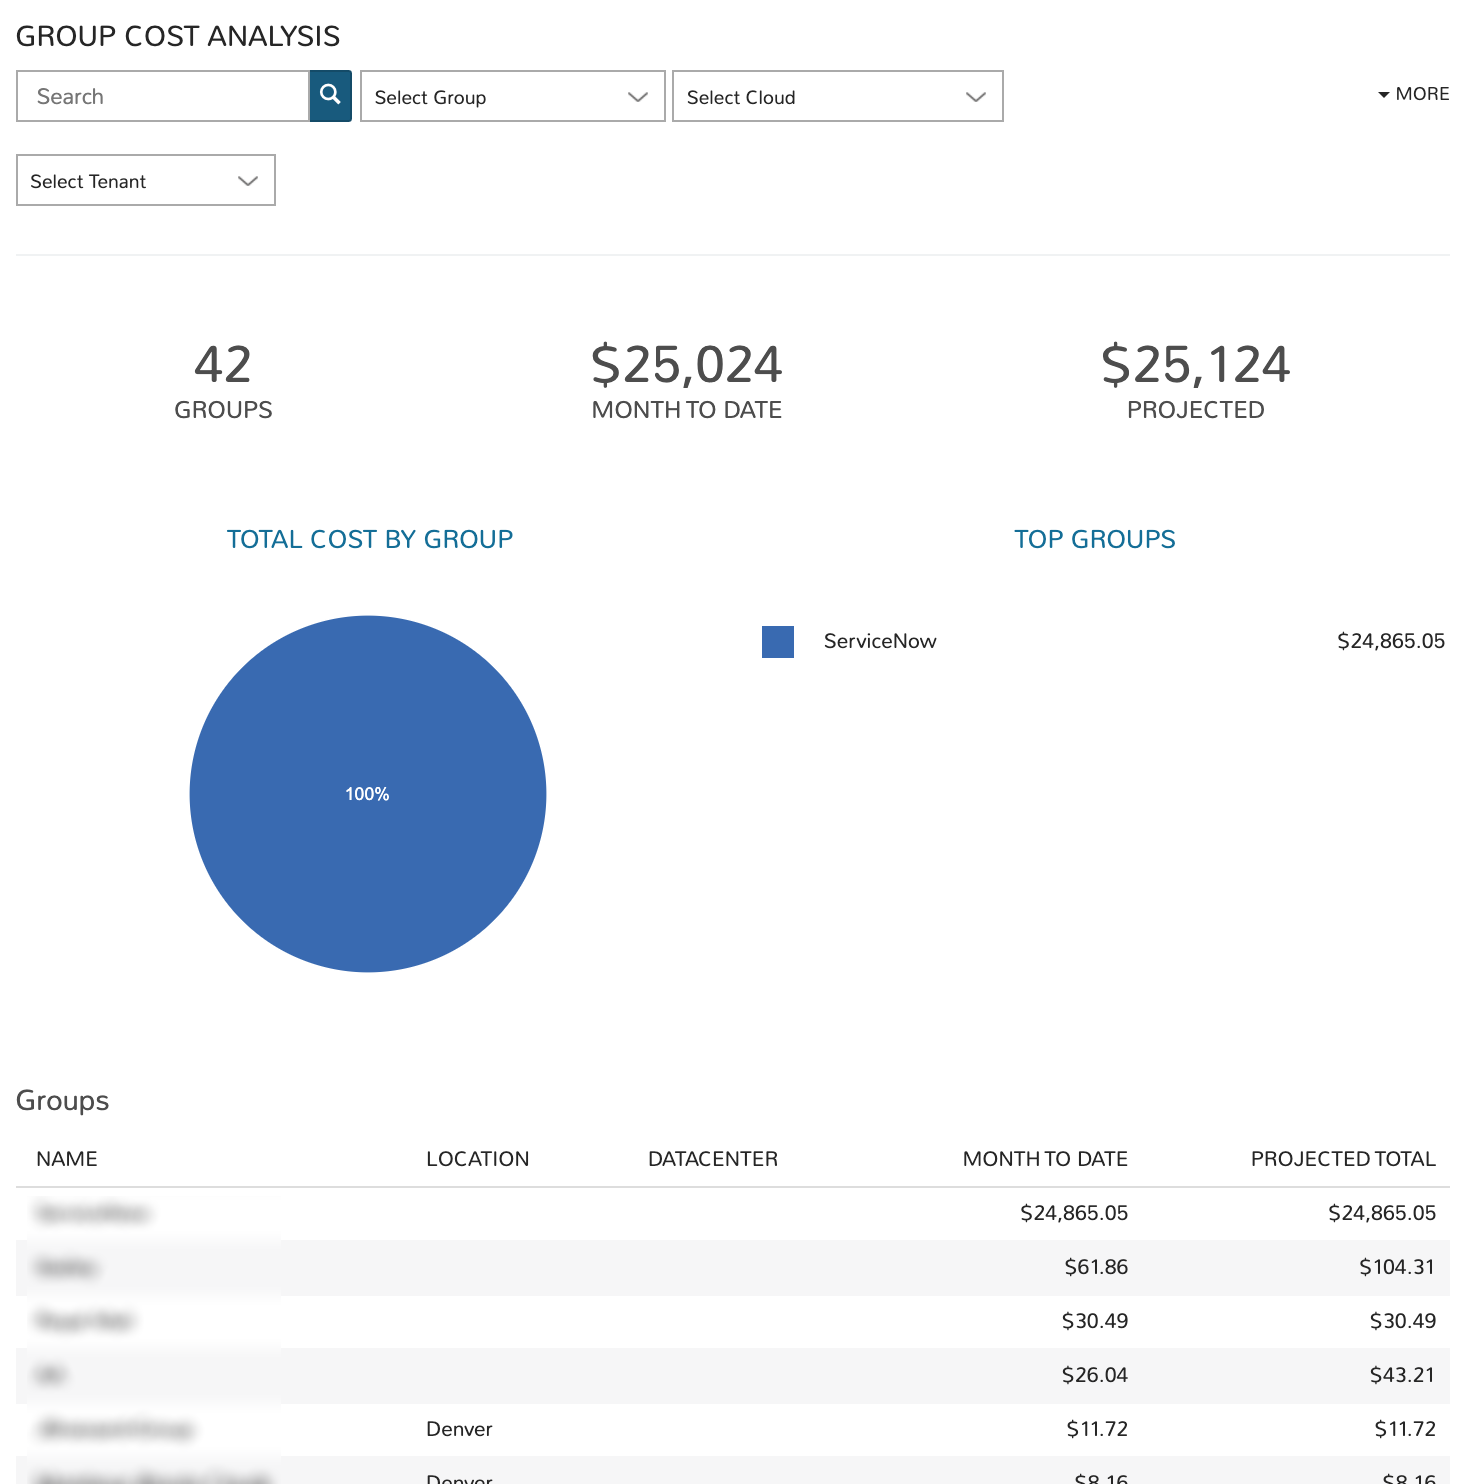
The Group Costing dashboard aggregates cost totals for all Groups that meet filters set on the dashboard. This allows administrators to sort Groups by their total costs and anticipate monthly total costs by Group.
Filters
Filter the Groups pulled into the dashboard by one or more of the following fields:
Group (all matched by search)
Group (selected from dropdown)
Cloud
Tenant
Data Displayed
The following aggregate totals are compiled for all Groups that meet set filters:
GROUPS: The total number of Groups that meet set filters
MONTH TO DATE: The total spend in the current month for all Groups meeting dashboard filters
PROJECTED: The projected total spend for the current month for all Groups meeting dashboard filters
Group List
Each Group that meets set filters is listed at the bottom of the dashboard, the following data points are revealed for each individual Group:
NAME: The name given to the Group in Morpheus at the time of creation
LOCATION: The Group location (if available)
DATACENTER: The Group datacenter (if available)
MONTH TO DATE: The current month-to-date spend for the individual Group listed
PROJECTED TOTAL: The projected total spend for the current month for the individual Group listed
Costing: Tenant Costing
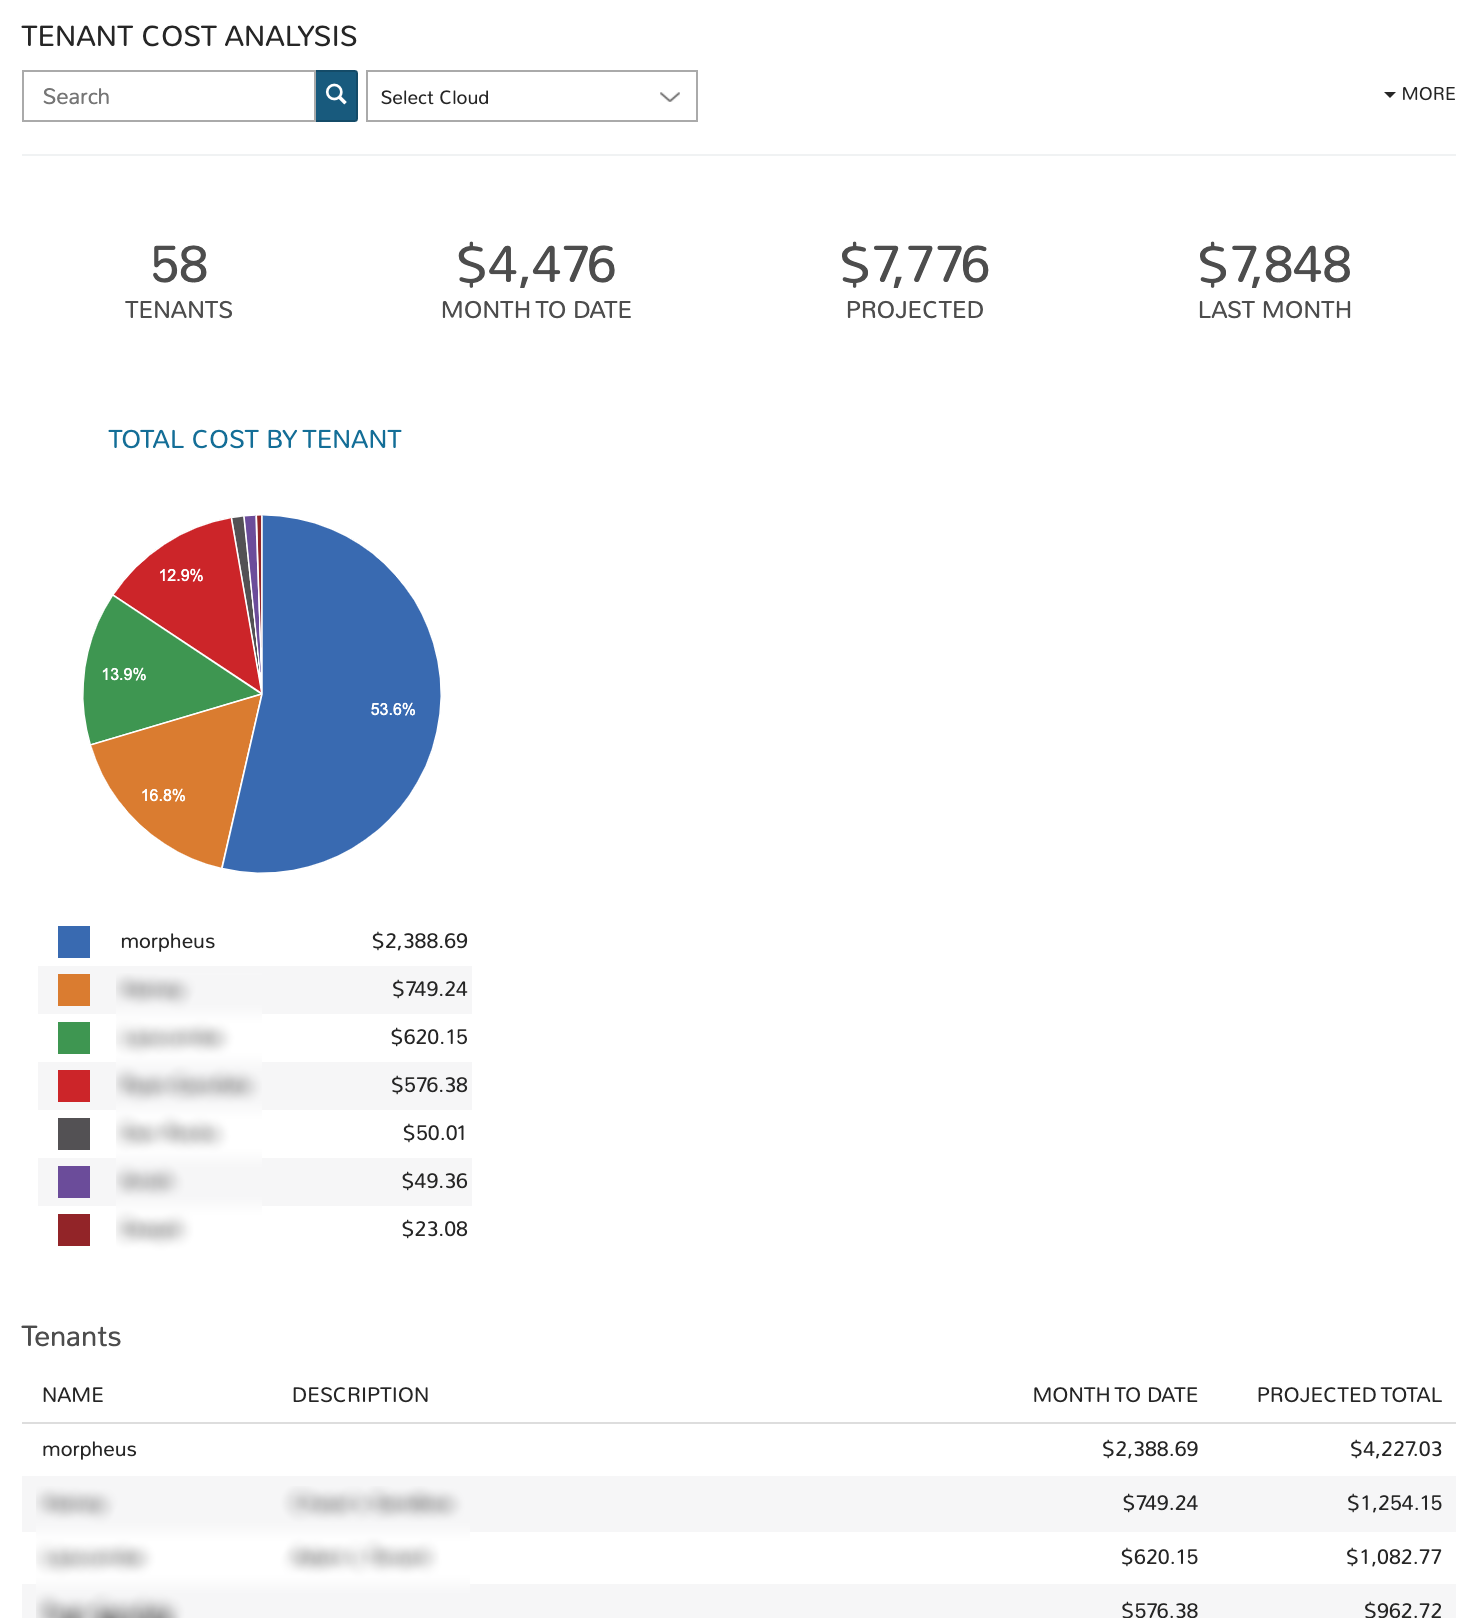
The Tenant Costing dashboard aggregates costing totals across all Tenants that meet the filters set on the dashboard. This information helps administrators track the current spend of each Tenant for the current monthly period. It also helps identify the costliest Tenants and to anticipate month-end costs for each individual Tenant.
Filters
Filter the Tenants pulled into the dashboard by one or more of the following fields:
Tenant (all matched by search)
Cloud
Tenant (selected from dropdown)
Data Displayed
The following aggregate totals are compiled for all Tenants that meet set filters:
TENANTS: The total number of Tenants that meet set filters
MONTH TO DATE: The total spend in the current month for all Tenants meeting dashboard filters
PROJECTED: The projected total spend for the current month for all Tenants meeting dashboard filters
LAST MONTH: The total spend in the prior month for all Tenants meeting dashboard filters
Tenant List
Each Tenant that meets set filters is listed at the bottom of the dashboard, the following data points are revealed for each individual Tenant:
NAME: The name given to the Tenant in Morpheus at the time of creation
DESCRIPTION: The Tenant description (if available)
MONTH TO DATE: The current month-to-date spend for the individual Tenant listed
PROJECTED TOTAL: The projected total spend for the current month for the individual Tenant listed
Costing: User Costing
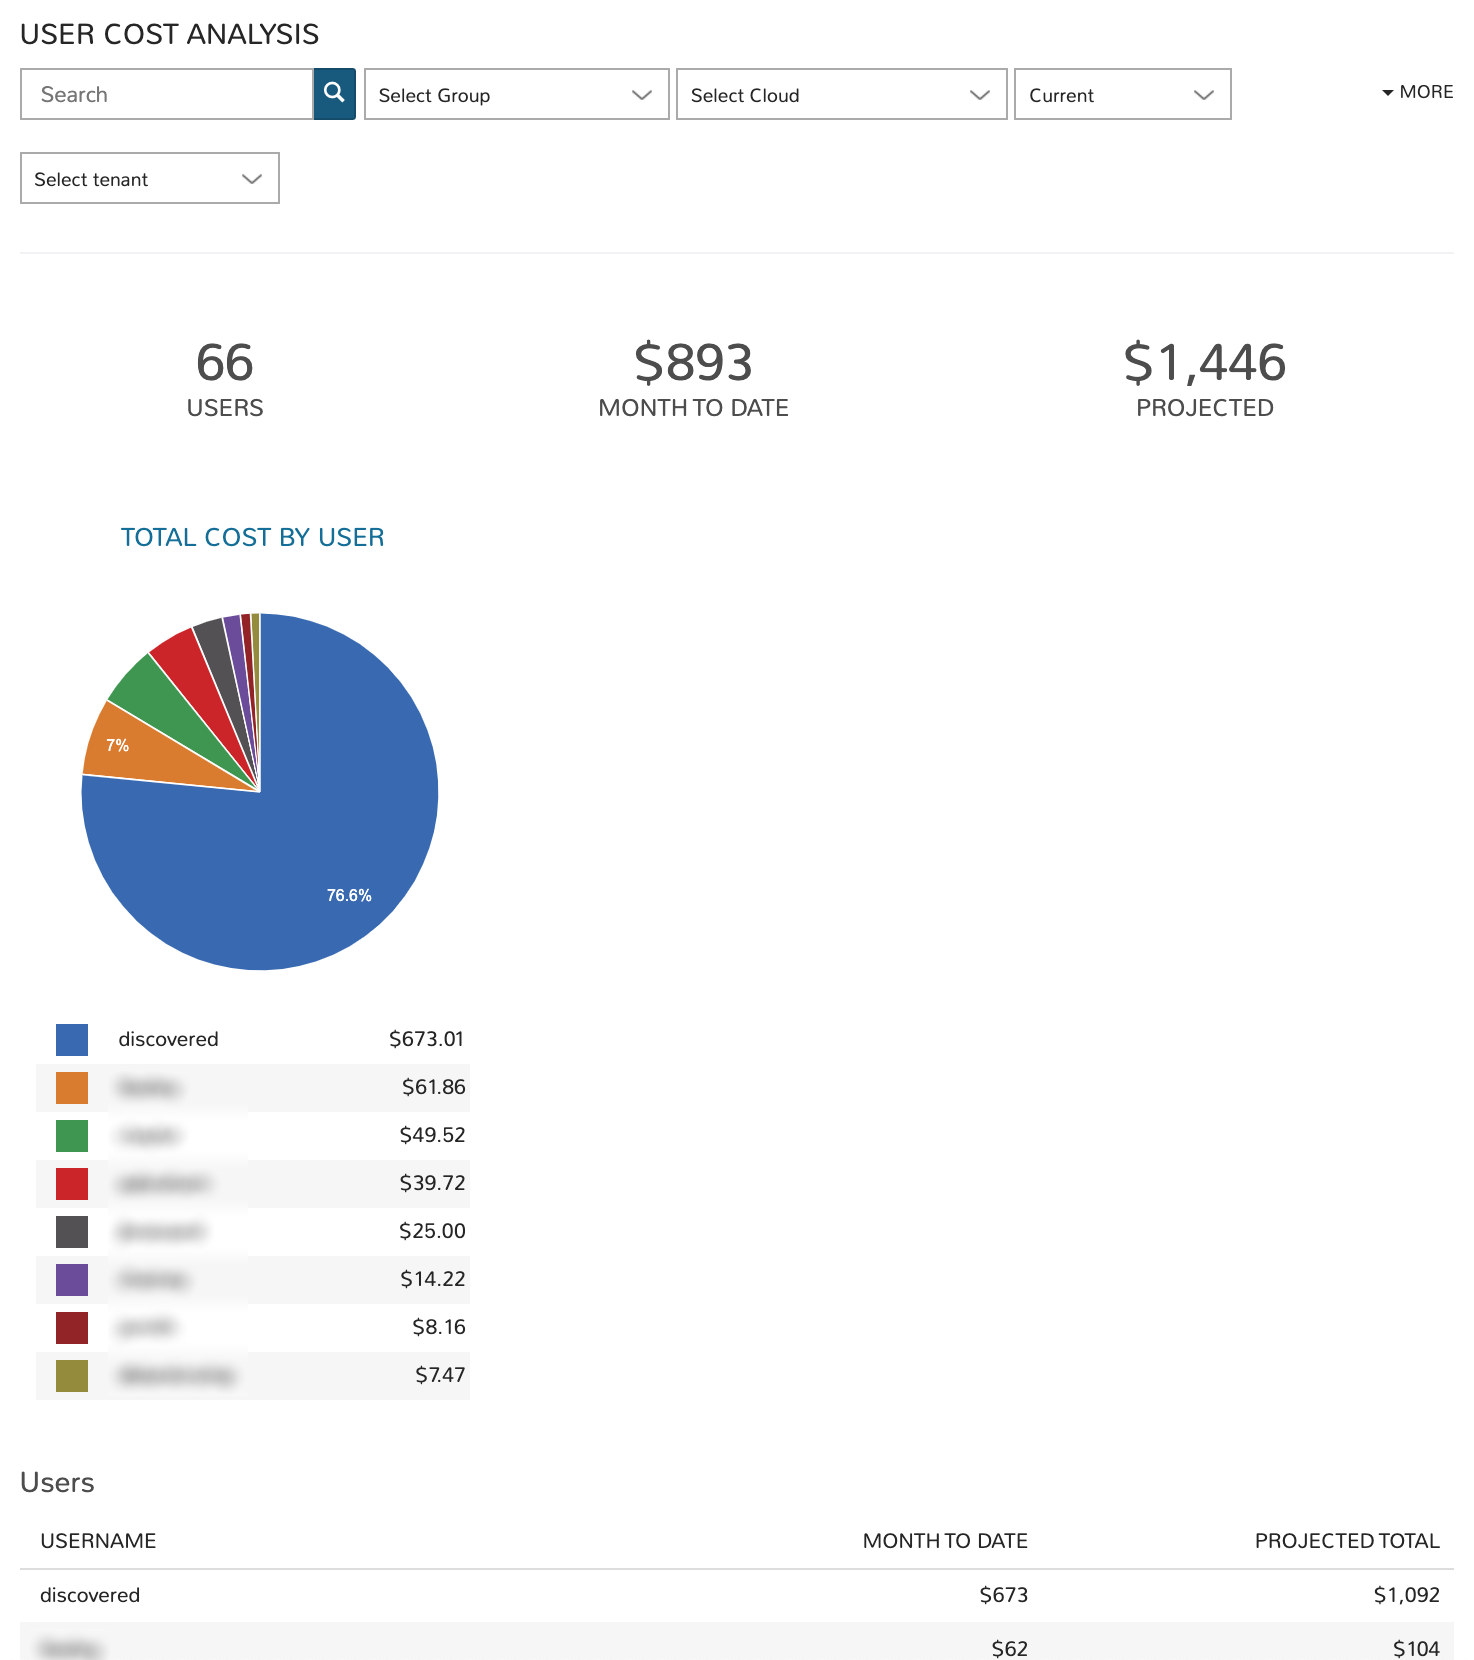
The User Costing dashboard allows administrators to analyze costs for a group of Users that meet specific filters. Once the group is selected, total costs by User for the current month and projected totals are displayed. Administrators can identify their costliest Users and anticipate the total cost by User for budgeting purposes.
Filters
Filter the Groups pulled into the dashboard by one or more of the following fields:
User (all matched by search)
Group
Cloud
Period (Current month, last three months, last six months, or last 12 months)
Tenant
Data Displayed
The following aggregate totals are compiled for all Users that meet set filters:
USERS: The total number of Users that meet set filters
MONTH TO DATE: The total spend in the current month for all Users meeting dashboard filters
PROJECTED: The projected total spend for the current month for all Users meeting dashboard filters
User List
Each User that meets set filters is listed at the bottom of the dashboard, the following data points are revealed for each individual User:
USERNAME: The username given to the User in Morpheus at the time of creation
MONTH TO DATE: The current month-to-date spend for the individual User listed
PROJECTED TOTAL: The projected total spend for the current month for the individual User listed
Costing: Workload Costing
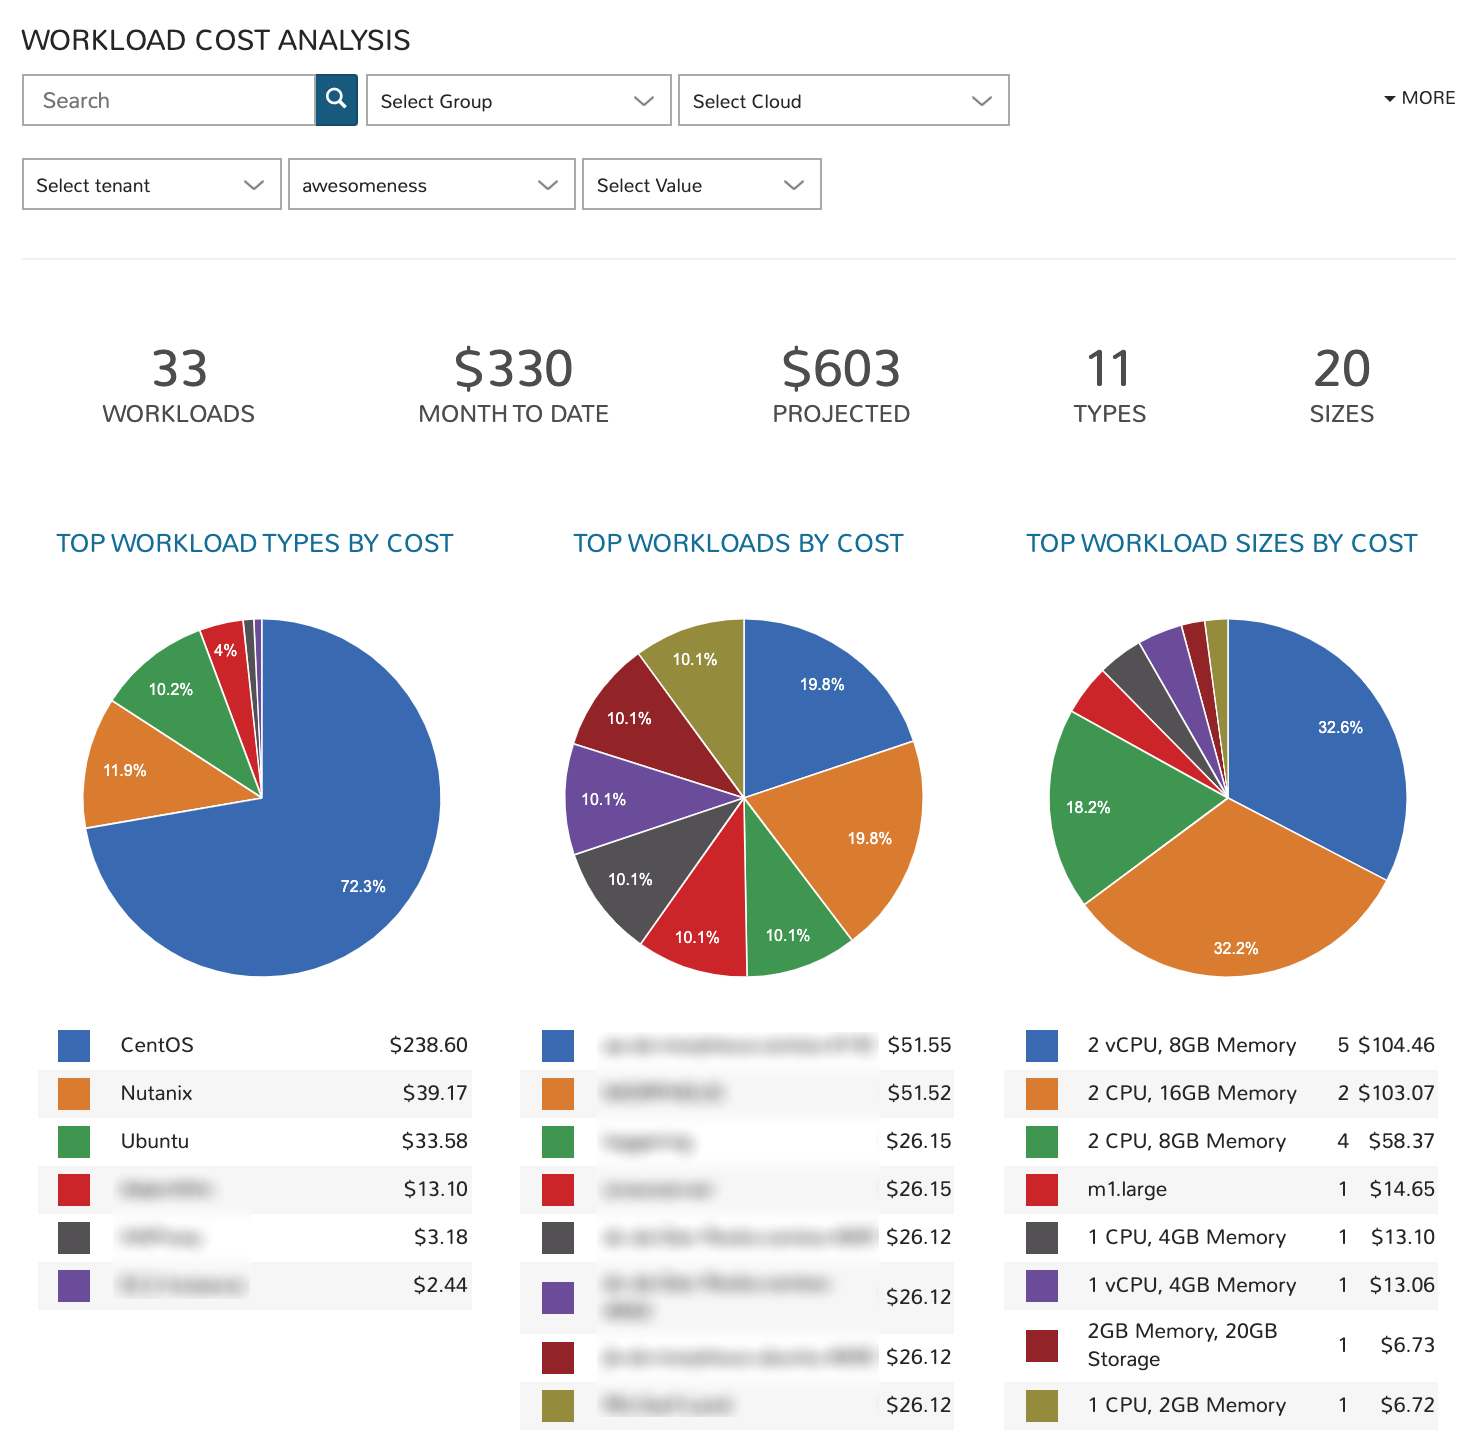
The Workload Costing dashboard allows administrators to look at all or a subset of Morpheus-managed workloads to analyze their cost impact. Filters can be set to isolate a specific group of workloads and cost breakdowns are shown. Graphs are generated to reveal cost breakdowns of individual workloads or certain groups of workloads.
Filters
Filter the workloads pulled into the dashboard by one or more of the following fields:
Workload name (all matched by search)
Group
Cloud
Tenant
Tag (Key). This is a required field and the top key in the list will be pre-selected by default
Value (tag value)
Data Displayed
The following aggregate totals are compiled for all workloads that meet set filters:
WORKLOADS: The total number of workloads that meet set filters
MONTH TO DATE: The total spend in the current month for all workloads meeting dashboard filters
PROJECTED: The projected total spend for the current month for all workloads meeting dashboard filters
TYPES: The total number of workload types represented among workloads meeting set filters
SIZES: The total number of unique workload sizes represented among workloads meeting set filters
Costing: Budget Analysis
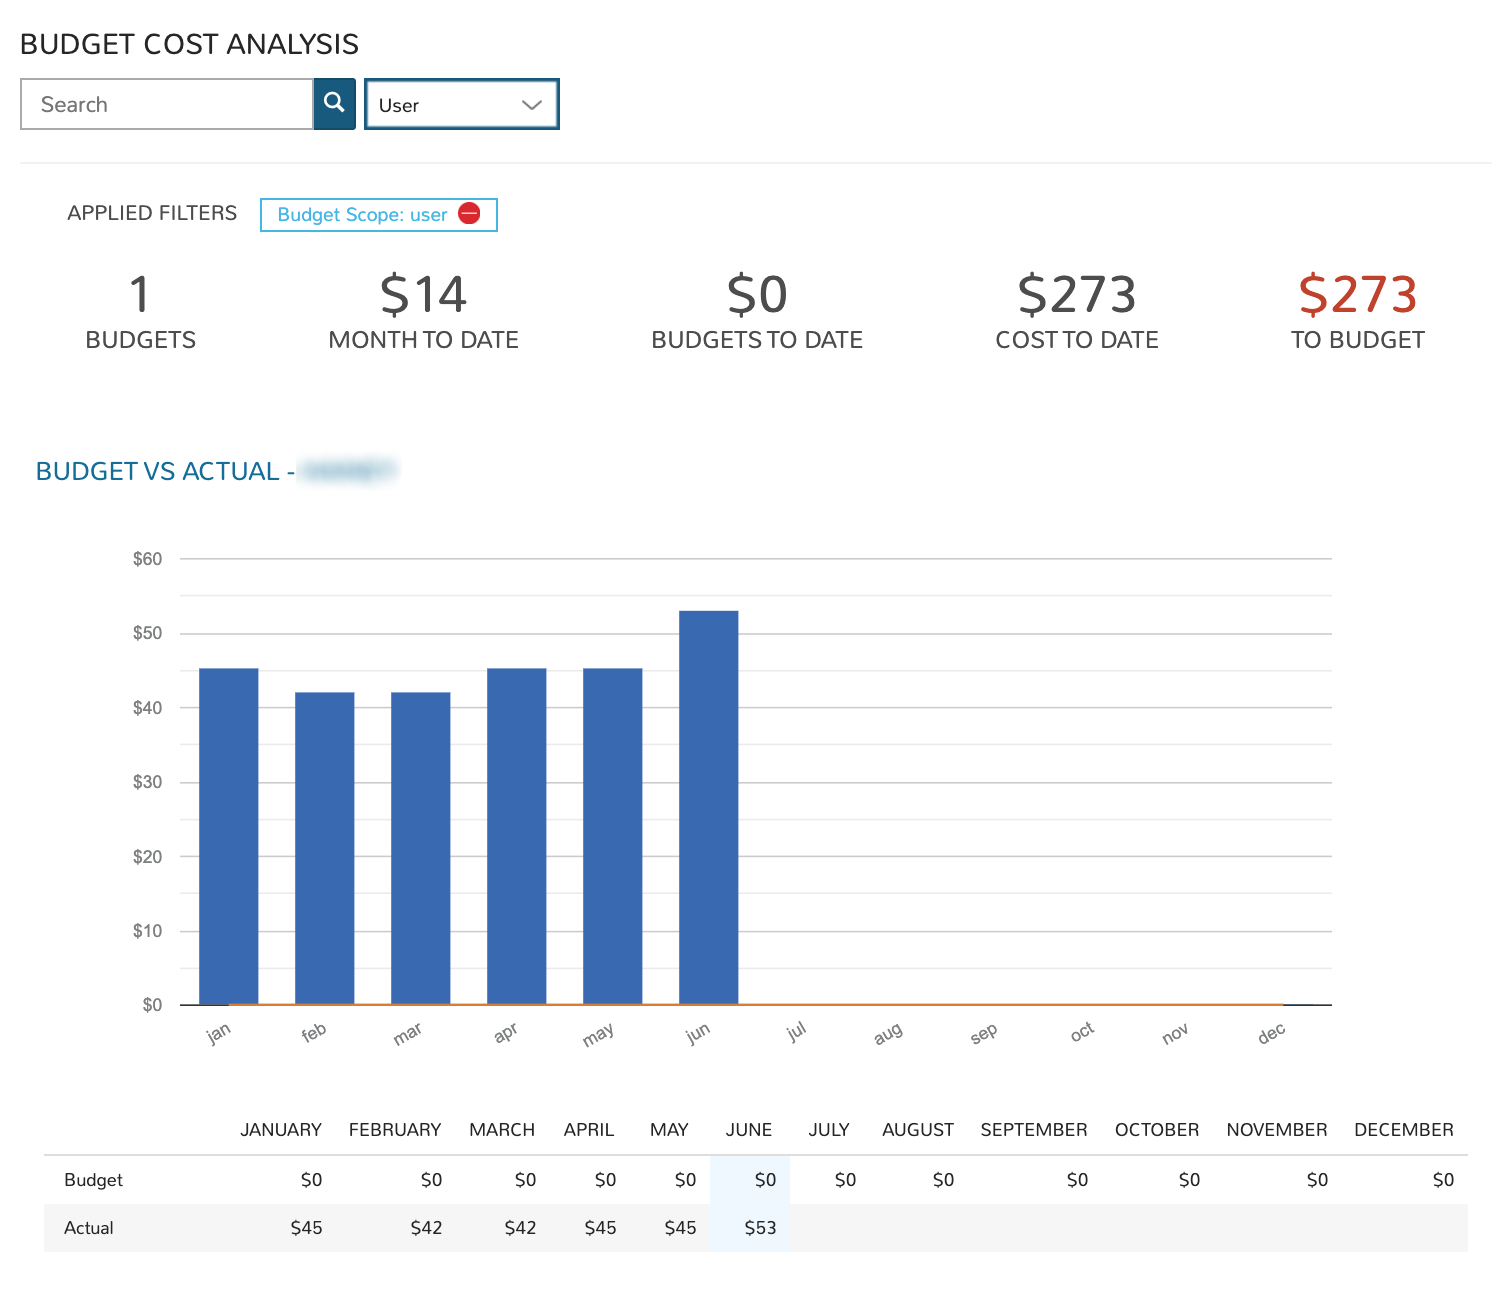
The Budget Analysis dashboard allows administrators to filter and view budgets in one place in order to keep track of progress against budget over time. Budgets in Morpheus (Operations > Budgets) are tied to a specific scope (Account, Tenant, Cloud, Group, or User) and budgets of the same scope are viewed together in this dashboard. A scope filter must be set in order for data to be populated into the dashboard. Once a scope is selected, the search bar can be utilized to return only budgets within the selected scope whose “Name” meets the search terms.
Filters
Filter the budgets pulled into the dashboard by one or more of the following fields:
Budget name (all matched by search)
Scope (This is a required field, data is not populated into the dashboard until a scope is specified)
Data Displayed
The following aggregate totals are compiled for all budgets that meet set filters:
BUDGETS: The total number of budgets that meet set filters
MONTH TO DATE: The total spend in the current month against the selected budgets
BUDGETS TO DATE: The total amount budgeted to date among budgets selected by the dashboard filters (from the start of the year to the end of the current interval)
TO BUDGET: The difference between the COST TO DATE and BUDGETS TO DATE value, should be close to $0 if the costs are appropriately tracking against the budgeted amounts
Budget List
Each budget with its own graph and breakdown is displayed going down the page. The format of the information presented depends on the interval that the specific budget is configured for.
Costing: Tag Costing
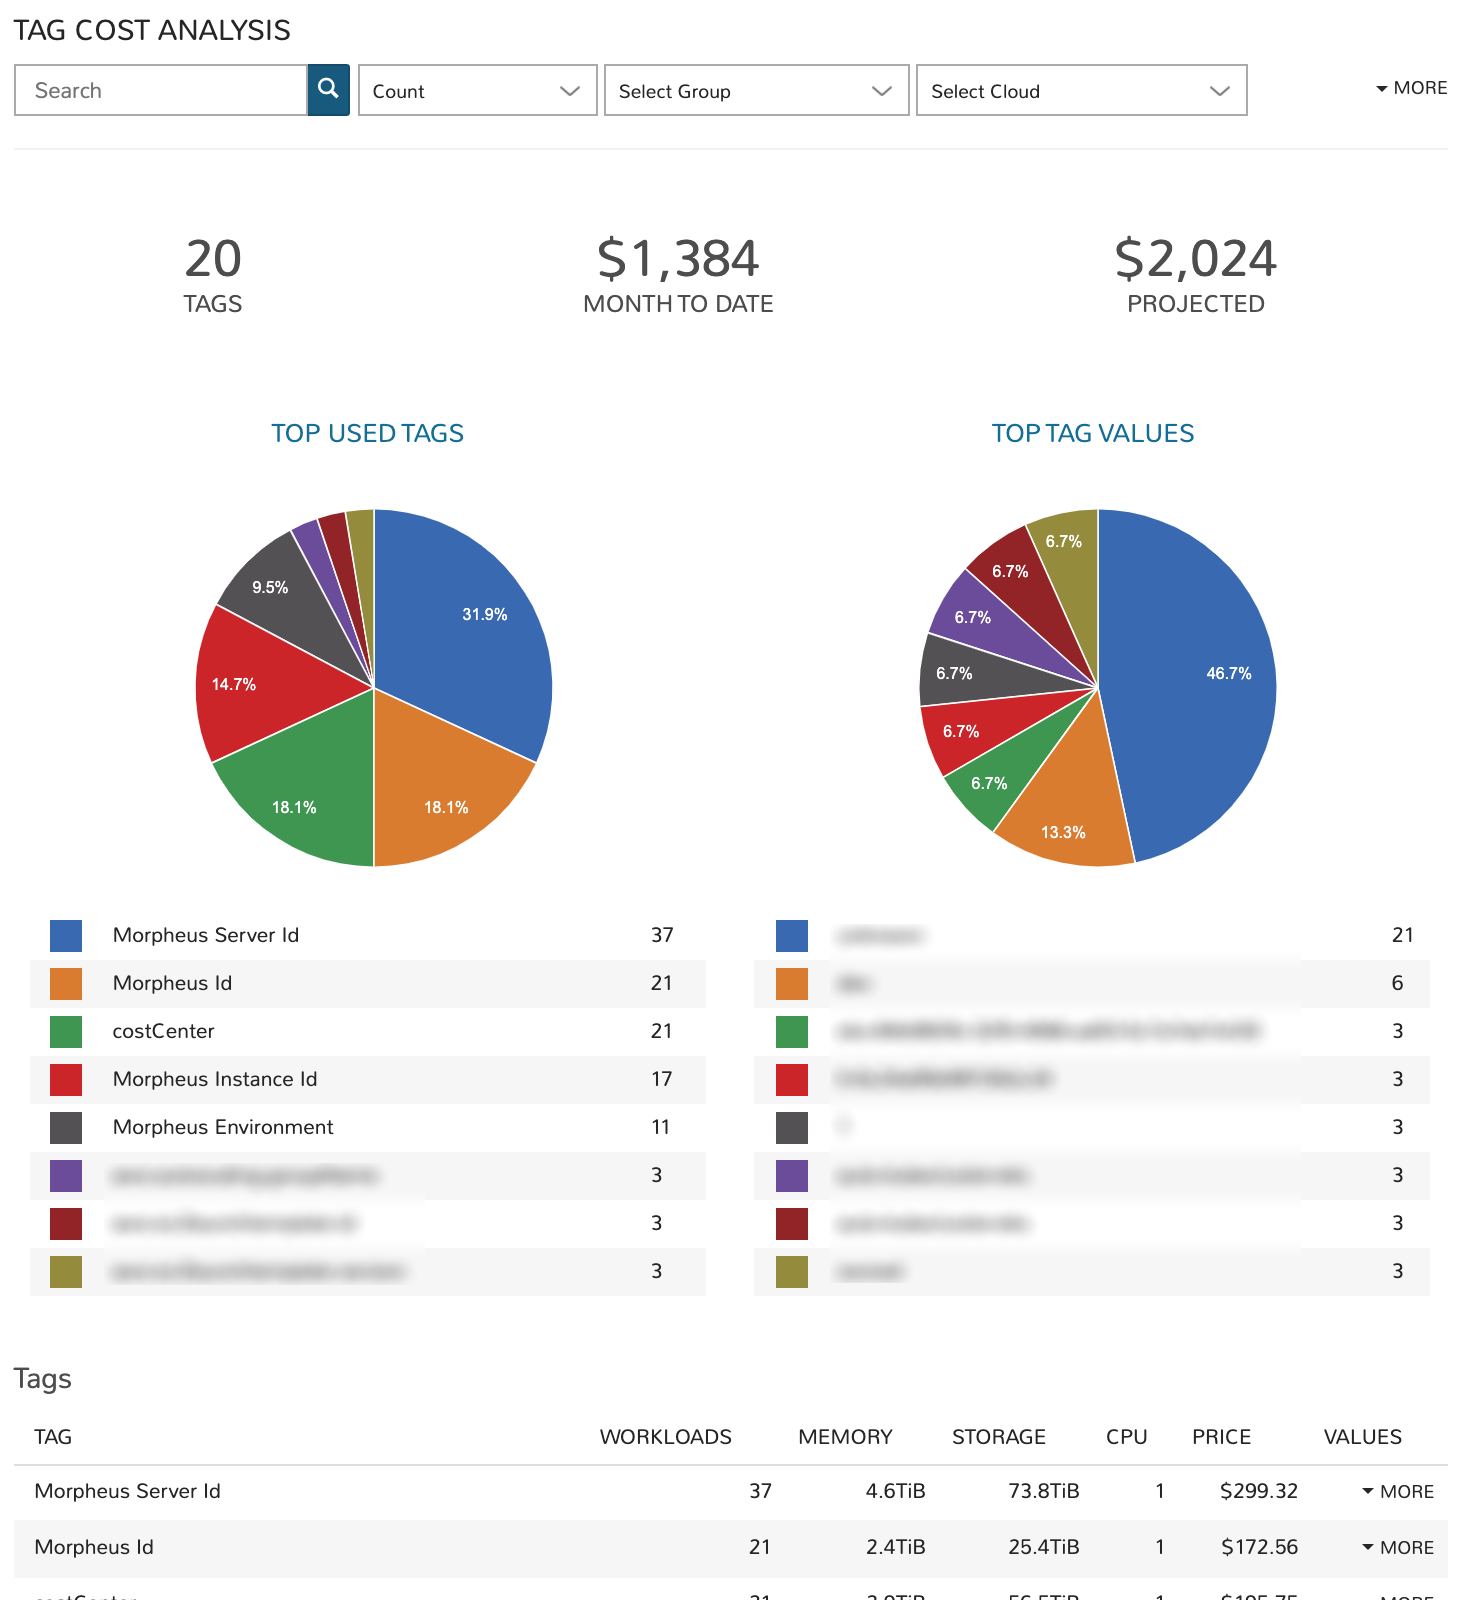
The Tag Analysis dashboard creates groups of workloads based on the presence of specific tags and meeting other filters. This workload group can be analyzed for total cost and projected costs.
Filters
Filter the workloads pulled into the dashboard by one or more of the following fields:
Tag key (all matched by search)
Metric (apply to see the top tag values by workload count, price, memory, storage, or CPU cores)
Group
Cloud
Tenant
Tag (Key)
Data Displayed
The following aggregate totals (by tag) are compiled for workloads that meet set filters:
TAGS: The total number of unique tag keys for workloads meeting dashboard filters
MONTH TO DATE: The total spend in the current month for selected workloads
PROJECTED: The total projected current-month spend for selected workloads
Tags List
A list of each tag (key) represented on selected workloads is displayed in a list below the dashboard graphs. We also see the total number of workloads associated with the tag, the total memory, total storage, total CPU cores, and total price. If we click the “MORE” link at the end of each row, we can see a list of all tag values associated with the key.
Utilization: Utilization vs Cost
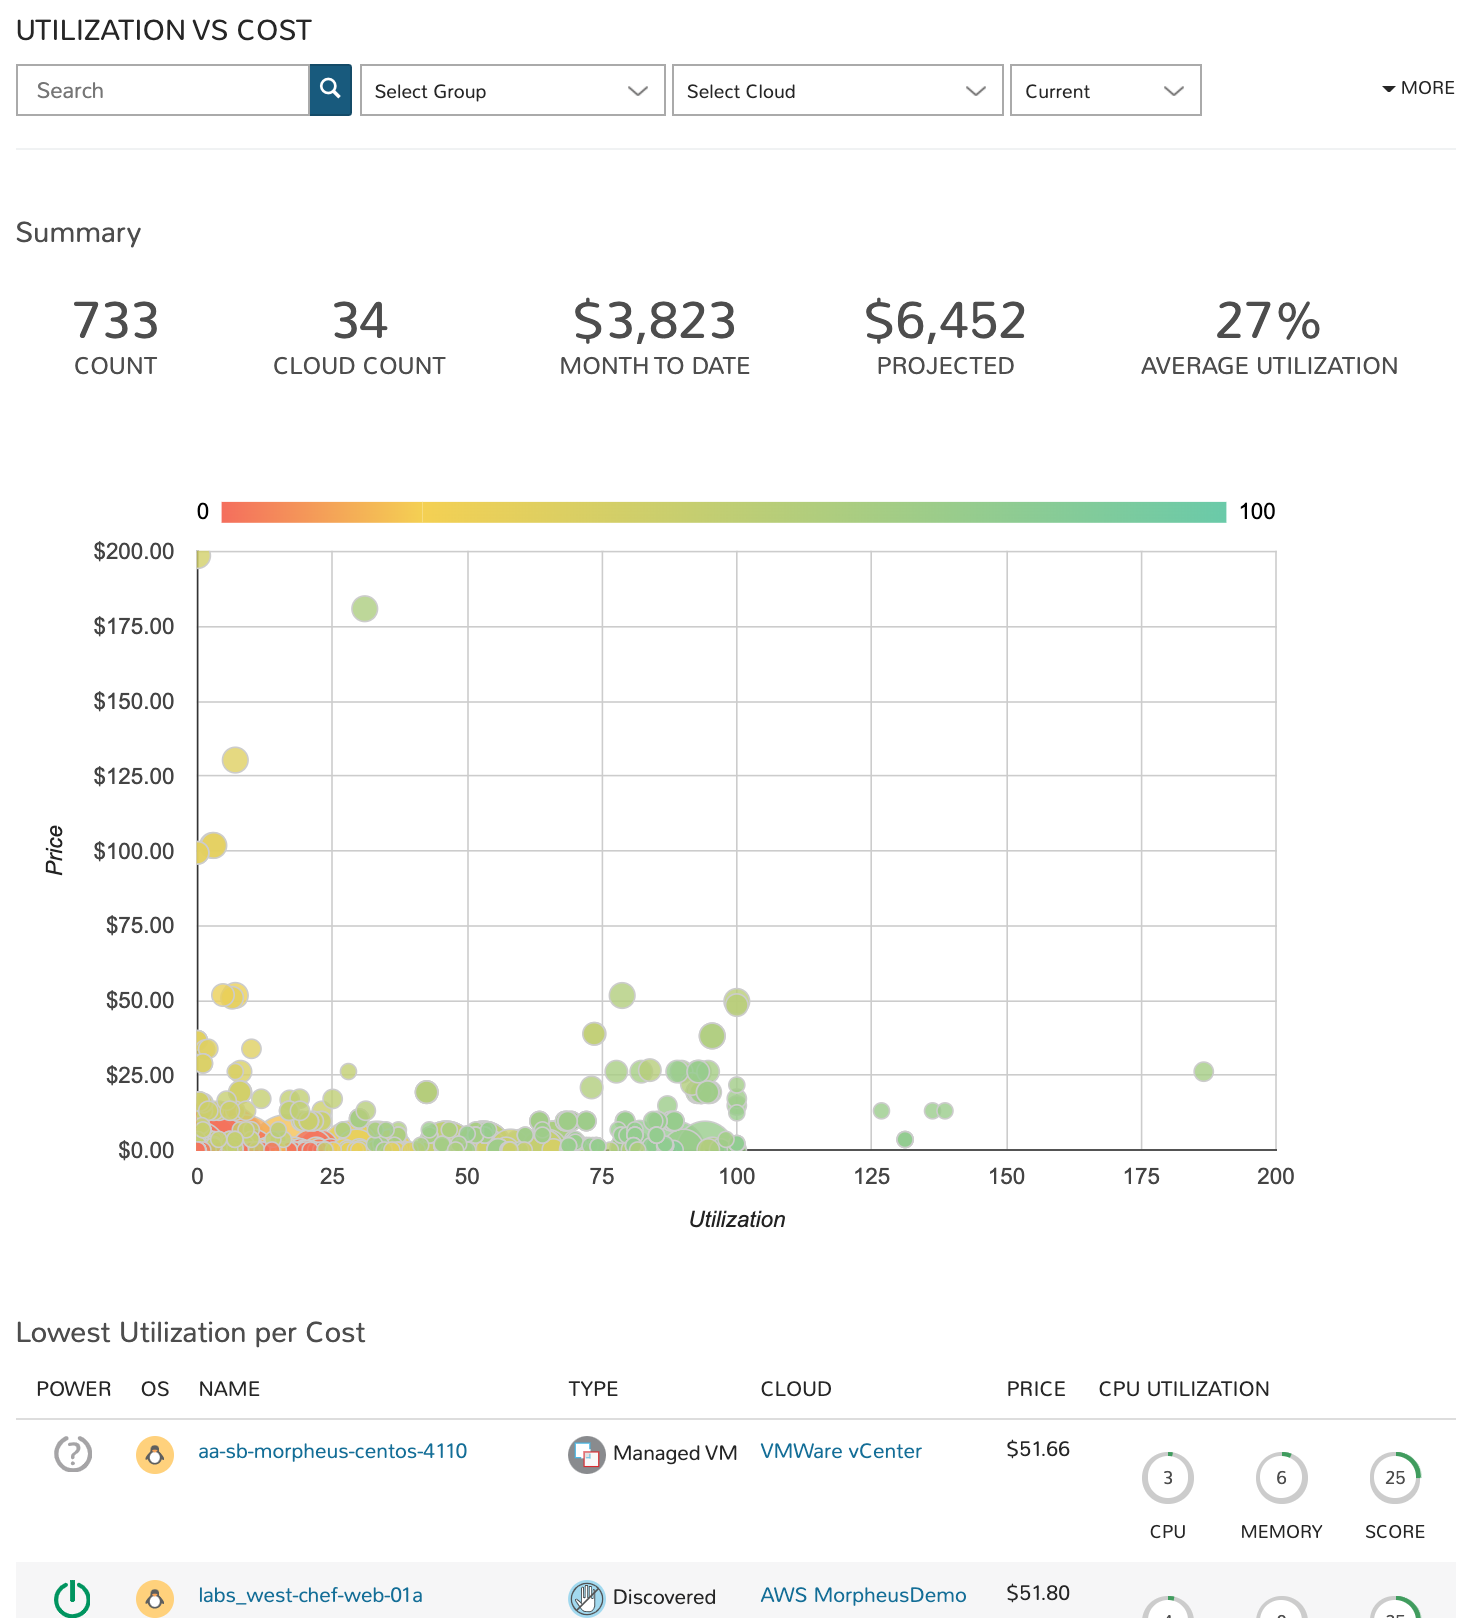
The Utilization vs Cost dashboard is designed to reveal workloads which are underutilized (expensive and seldom-used) and which are very cost-efficient (inexpensive and frequently-used). Administrators can filter the workloads considered by the dashboard through the use of filters and potentially identify areas of cost savings by decommissioning seldom-used machines.
Filters
Filter the workloads pulled into the dashboard by one or more of the following fields:
Workload name (all matching search terms)
Time period (Current, one-day average, one-week average, one-month average, three-month average, six-month average, or one-year average)
Type (virtual machines, hosts, or bare metal)
Tenant
Tag (Key)
Value (Tag value)
Data Displayed
The following aggregate totals are compiled for workloads that meet set filters:
COUNT: The total number of workloads that meet dashboard filters
CLOUD COUNT: The total number of Clouds represented by the selected workloads
MONTH TO DATE: The total spend in the current month for selected workloads
PROJECTED: The total projected current-month spend for selected workloads
AVERAGE UTILIZATION: The computed average utilization figure for all workloads selected by dashboard filters
Utilization List
In addition to the totals and graph displayed, two workload lists are given showing the least utilized workloads by cost (lowest utilization per cost dollar) and the least utilized workloads overall (lowest utilization overall). These workloads are listed with links to the Instance or server detail pages, along with other details related to price and resource utilization.
Workloads: Instance Type Usage
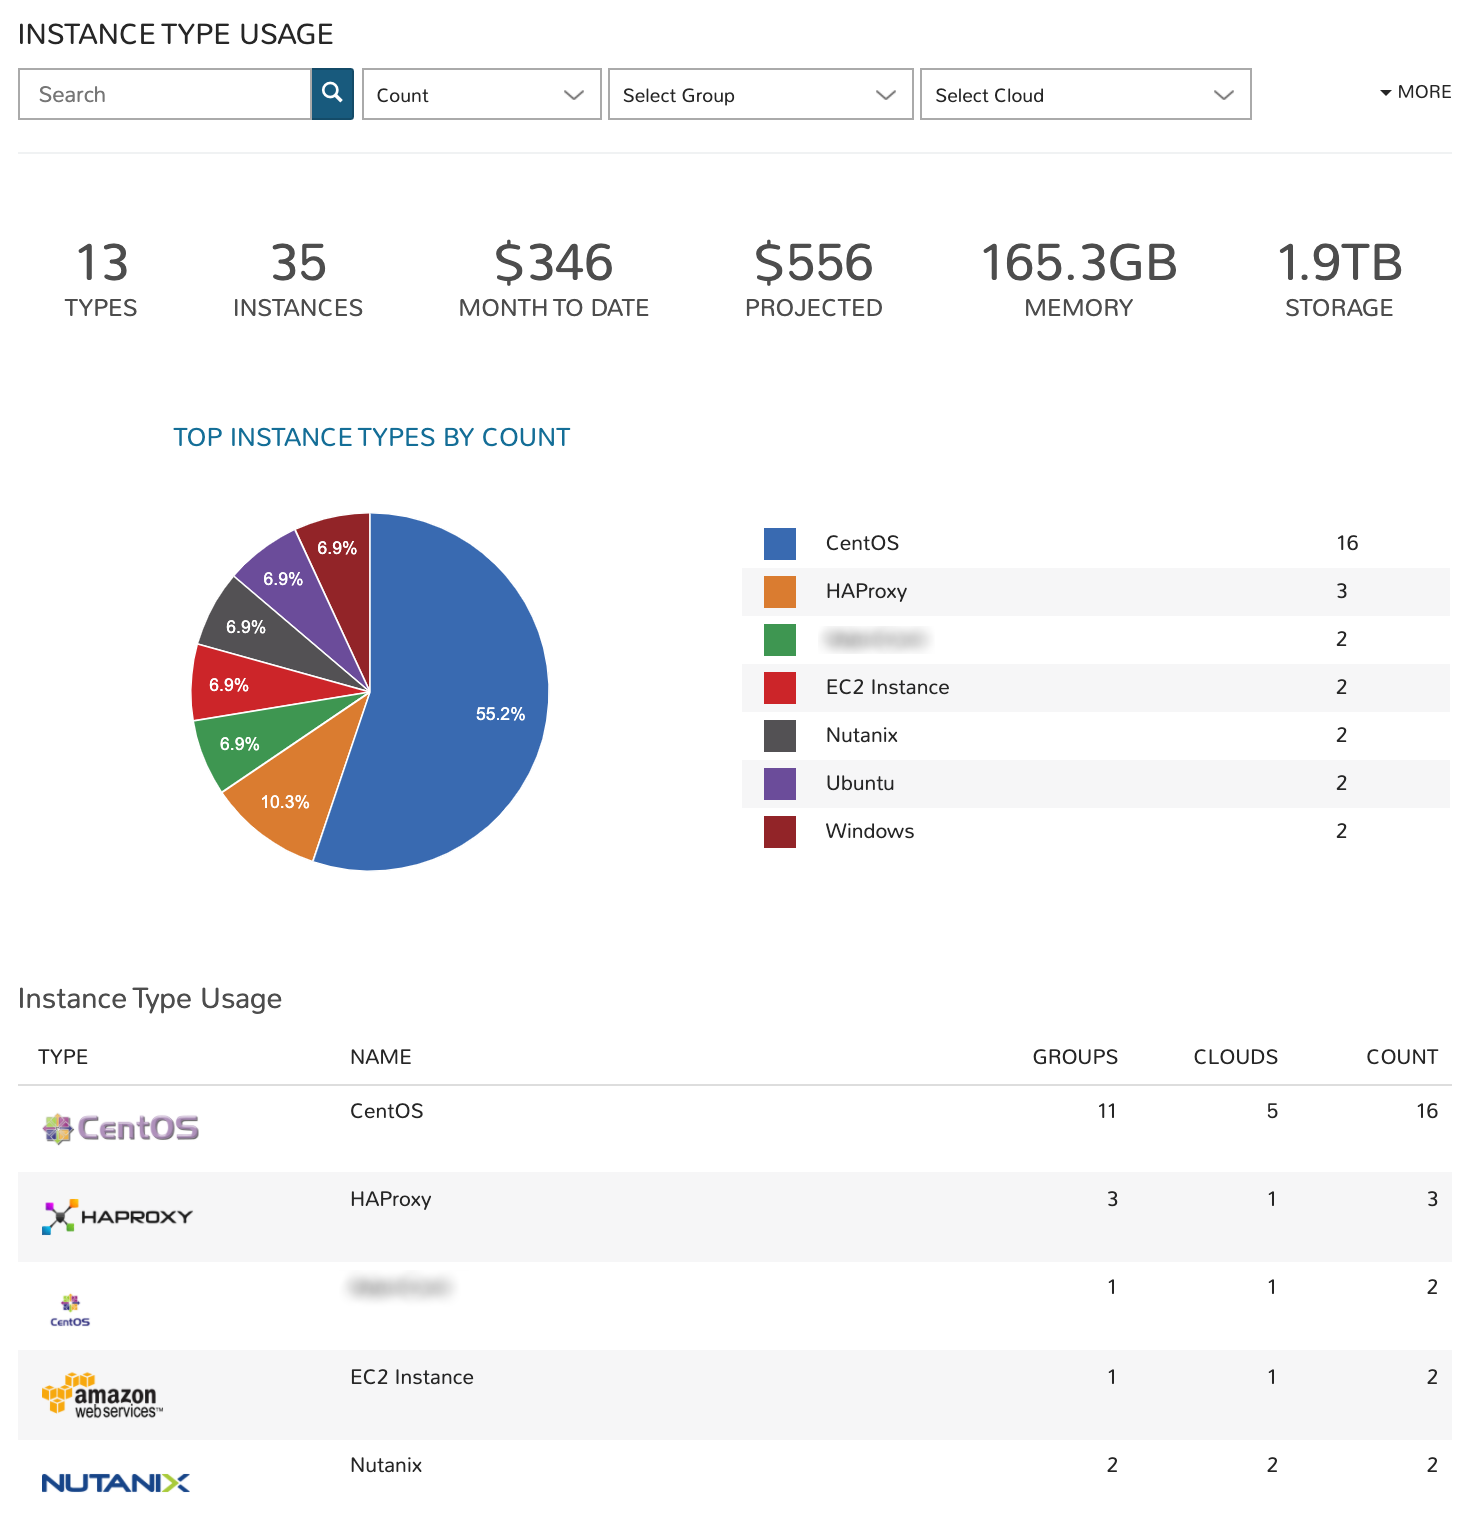
The Instance Type Usage dashboard organizes workloads meeting dashboard filters by their Instance type. In additional to counts, administrators can view resource consumption and cost figures by Instance type groupings as well.
Filters
Filter the workloads pulled into the dashboard by one or more of the following fields:
Instance type name (all matching search terms, Morpheus-default Instance types are not included when using the search filter)
Metric (apply to see the top Instance types by workload count, price, memory, storage, or CPU cores)
Group
Cloud
Tenant
Tag (Key)
Value (Tag value)
Data Displayed
The following aggregate totals are compiled for workloads that meet set filters:
TYPES: The total number of Instance types represented among workloads meeting the dashboard filters
INSTANCES: The total number of Instances represented in the data
MONTH TO DATE: The total spend in the current month for selected workloads
PROJECTED: The total projected current-month spend for selected workloads
MEMORY: The total memory allotted to selected workloads
STORAGE: The total storage allotted to selected workloads
Instance Type Usage List
Each Instance type represented in the dashboard is listed below the graph. For each Instance type shown, we see the number of Groups the Instance type is represented in, the number of Clouds the Instance type has been provisioned into, and the total amount of memory allotted to workloads of each Instance type.
Workloads: Instance Usage
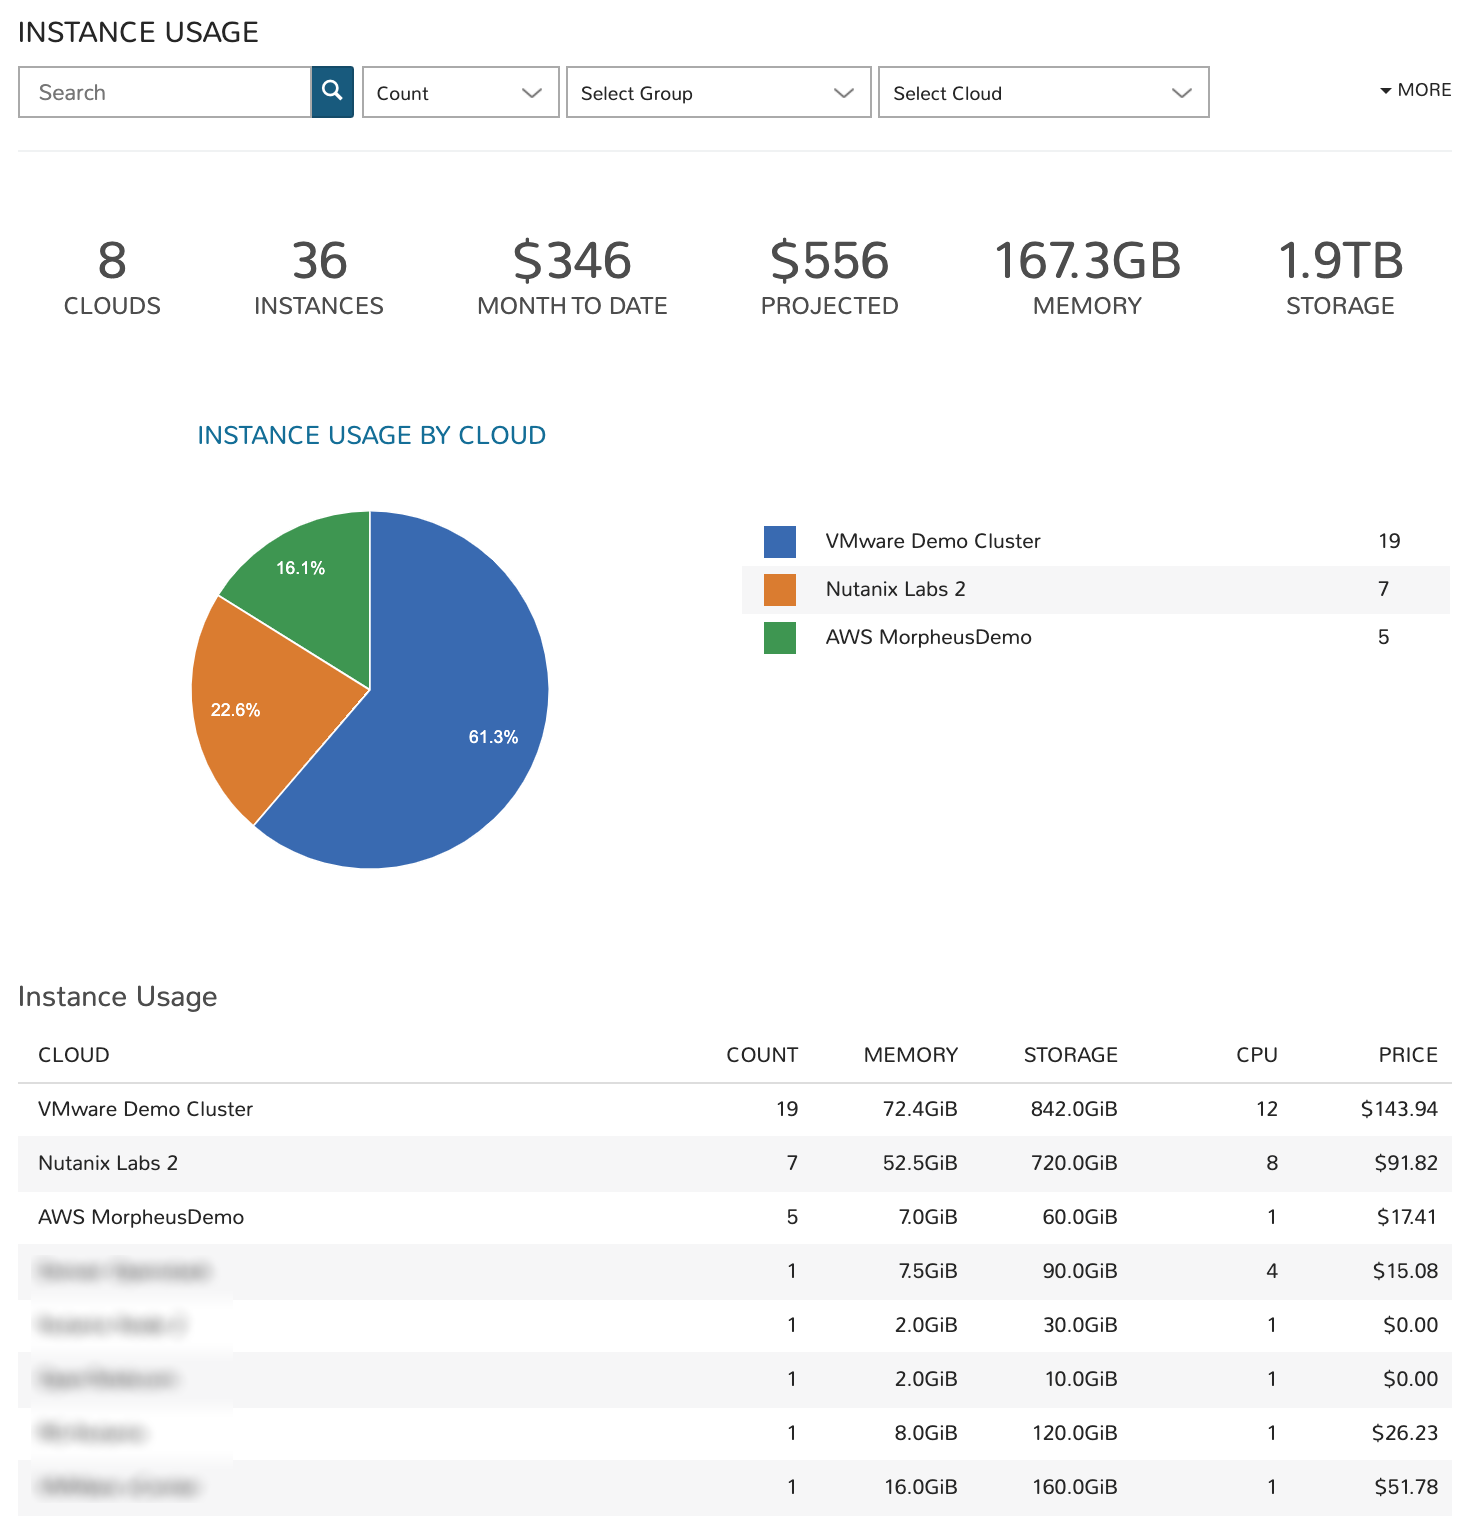
The Instance Usage dashboard shows Instance counts, resource utilization, and cost breakdowns by Cloud. Administrators can set filters to limit the workloads that are considered for dashboard analysis and then see the results given by Cloud groupings.
Filters
Filter the workloads pulled into the dashboard by one or more of the following fields:
Instance name (all matching search terms)
Metric (apply to see the top Clouds by workload count, price, memory, storage, or CPU cores)
Group
Cloud
Tenant
Tag (Key)
Value (Tag value)
Data Displayed
The following aggregate totals are compiled for workloads that meet set filters:
CLOUDS: The total number of Clouds represented among workloads meeting the dashboard filters
INSTANCES: The total number of Instances represented in the data
MONTH TO DATE: The total spend in the current month for selected workloads
PROJECTED: The total projected current-month spend for selected workloads
MEMORY: The total memory allotted to selected workloads
STORAGE: The total storage allotted to selected workloads
Instance Usage List
All Clouds represented in the dashboard are listed here. For each Cloud, we see the total Instance count, total memory allotted, total storage allotted, total CPU cores, and the total price.
Workloads: Blueprint Usage
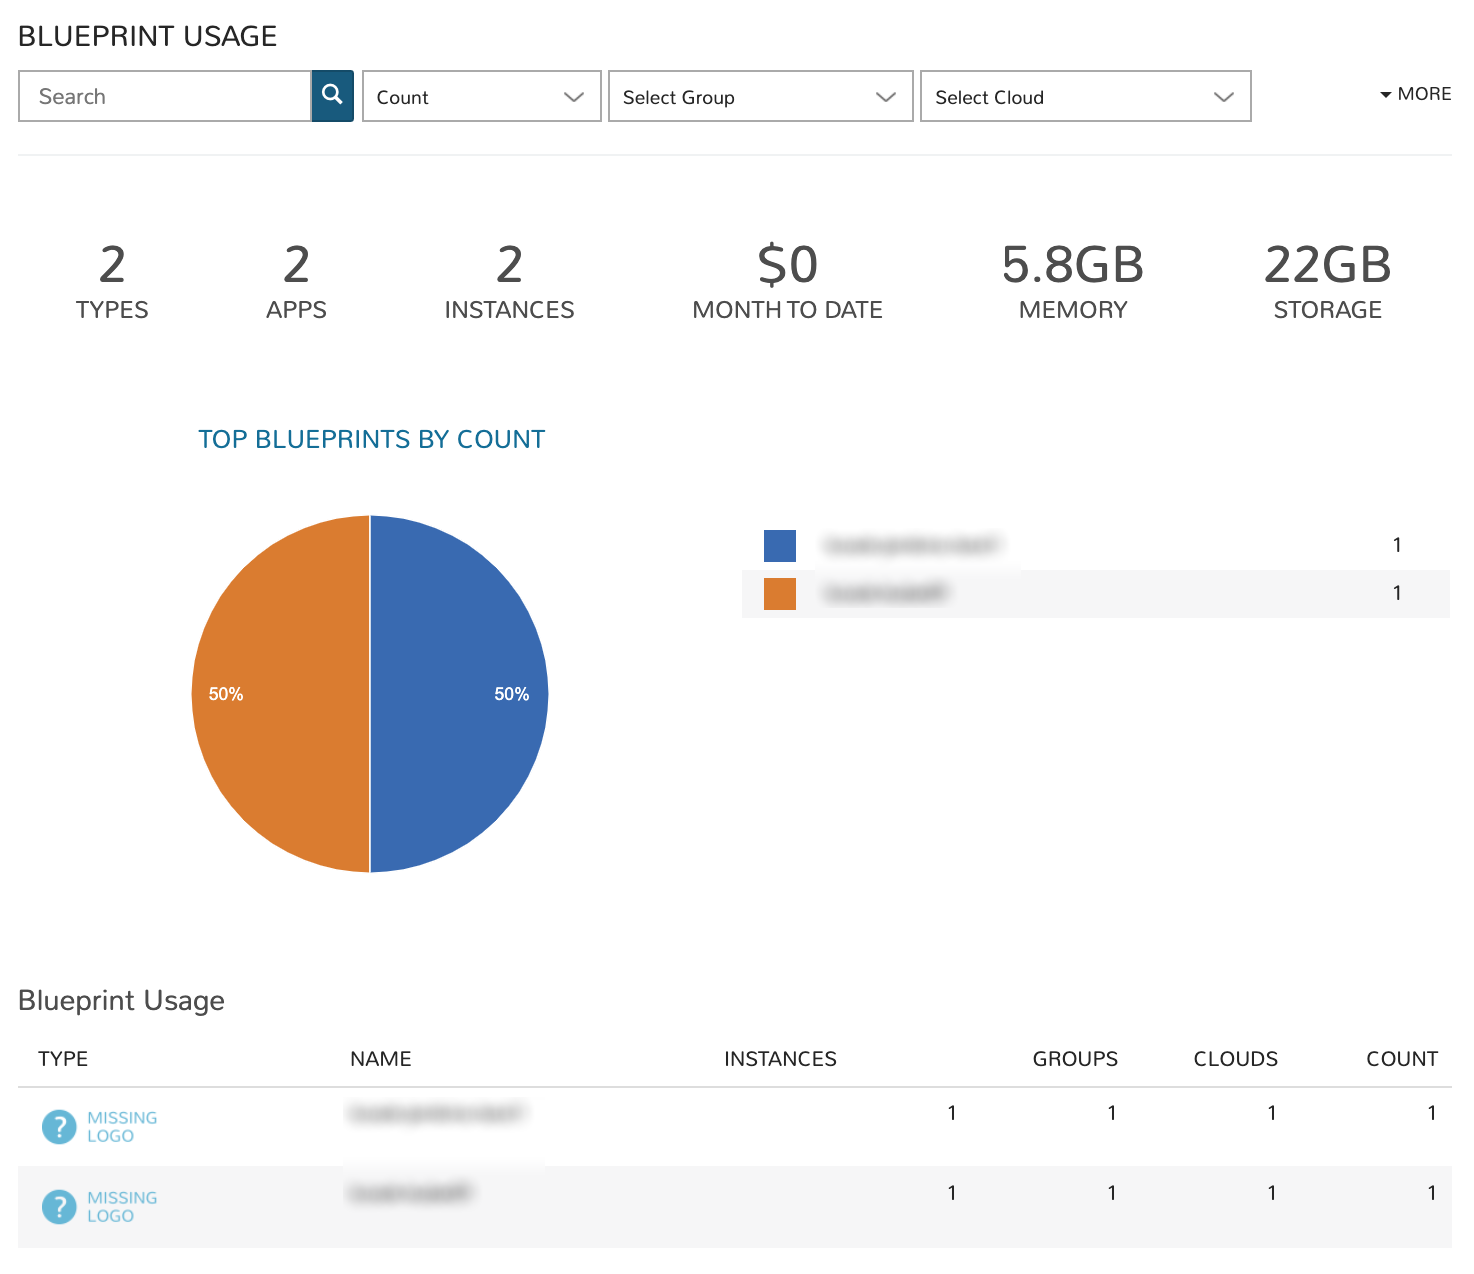
The Blueprint Usage dashboard lists all provisioned Apps that meet filters set on the dashboard. Once the desired group of Apps is filtered into the dashboard, administrators will see the total provisioned from each Blueprint, total number of Instances created from the Apps, and costing details.
Filters
Filter the Apps pulled into the dashboard by one or more of the following fields:
App name (all matching search terms)
Metric (apply to see the top Clouds by workload count, price, memory, storage, or CPU cores)
Group
Cloud
Tenant
Tag (Key)
Value (Tag value)
Data Displayed
The following aggregate totals are compiled for Apps that meet set filters:
TYPES: The total number of App types represented among Apps meeting the dashboard filters
APPS: The total number of Apps represented in the dashboard
INSTANCES: The total number of Instances contained in all Apps meeting dashboard filters
MONTH TO DATE: The total month-to-date spend for all Apps shown in the dashboard
MEMORY: The total memory allotted to selected Apps
STORAGE: The total storage allotted to selected Apps
Blueprint Usage List
All Blueprints which have a currently-existing App provisioned from them and selected in the dashboard filters are listed here. The name and type of the Blueprint is listed along with the total number of Instances across all provisionings, total Groups, total Clouds, and the total count of all Apps from that Blueprint.
Workloads: Apps Usage
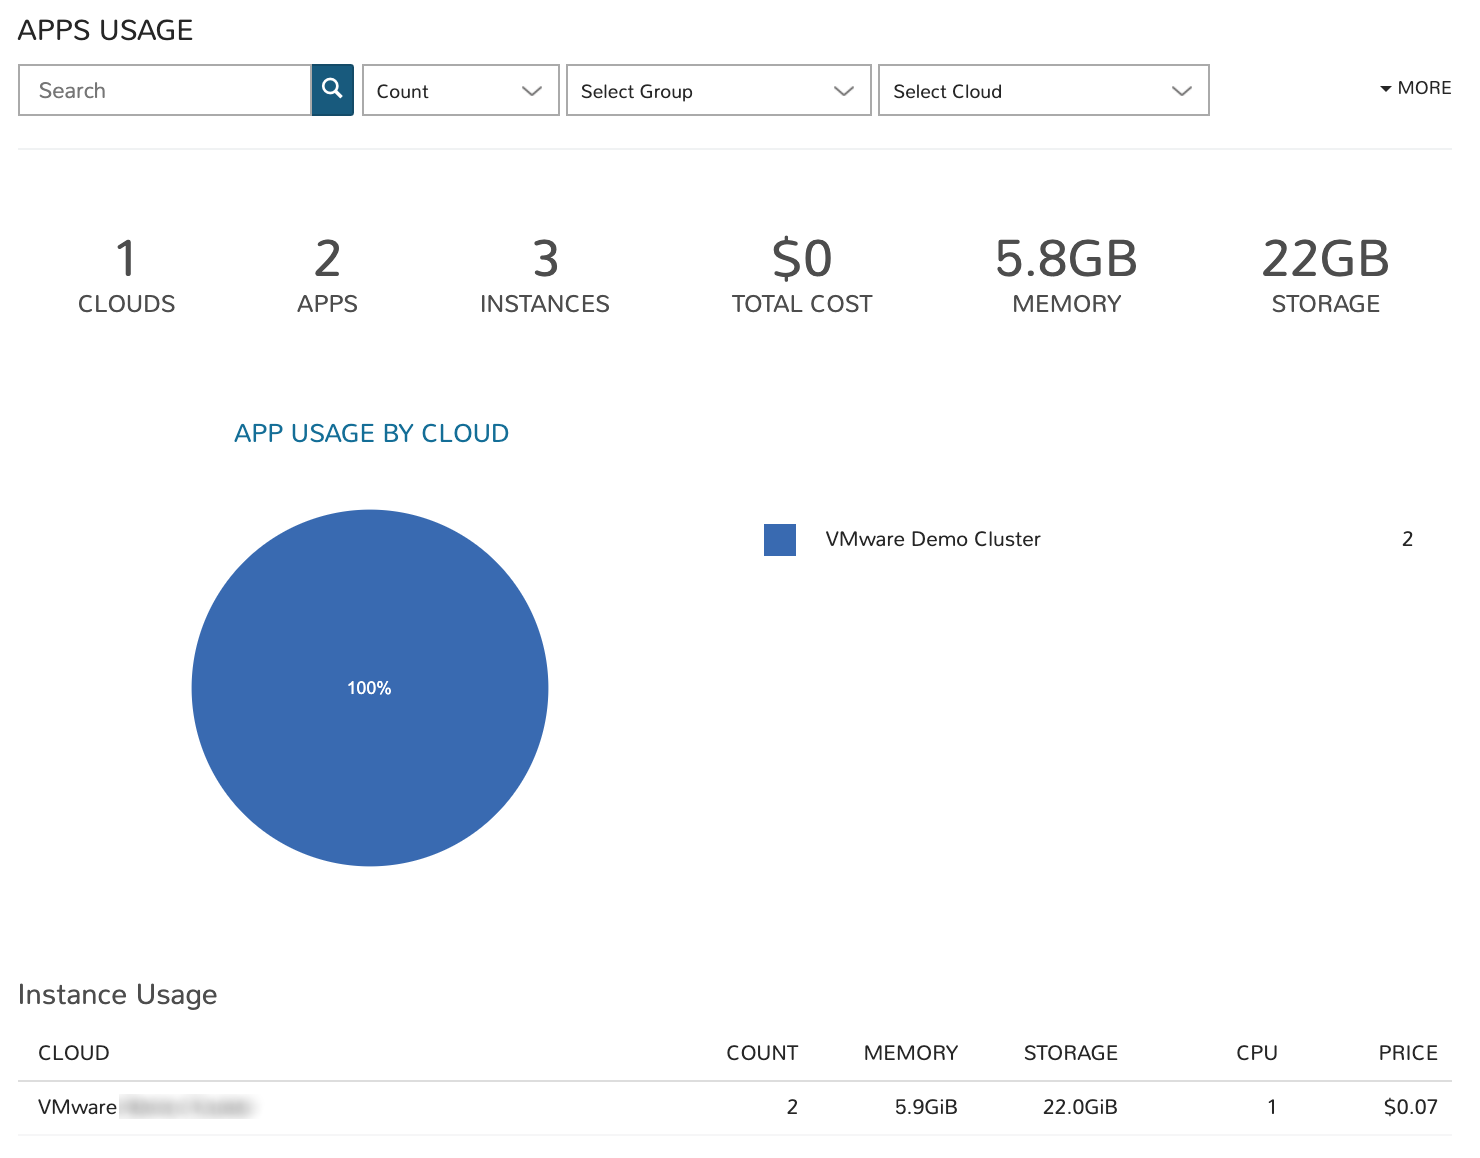
The Apps Usage dashboard lists all provisioned Apps that meet a set of filters and organizes them by Cloud. Totals for cost and resource usage of all relevant Apps can be viewed with a per-Cloud breakdown.
Filters
Filter the Apps pulled into the dashboard by one or more of the following fields:
App name (all matching search terms)
Metric (apply to see the top Clouds by workload count, price, memory, storage, or CPU cores)
Group
Cloud
Tenant
Tag (Key)
Value (Tag value)
Data Displayed
The following aggregate totals are compiled for Apps that meet set filters:
CLOUDS: The total number of Clouds represented among Apps meeting the dashboard filters
APPS: The total number of Apps represented in the dashboard
INSTANCES: The total number of Instances contained in all Apps meeting dashboard filters
TOTAL COST: The total cost of all selected Apps
MEMORY: The total memory allotted to selected Apps
STORAGE: The total storage allotted to selected Apps
Instance Usage List
All Clouds with a currently-provisioned App which is selected in the dashboard filters are listed here. The name of the Cloud is listed along with its App count, the total memory, total storage, total CPU cores and price of the Apps provisioned in that Cloud are also listed.