Dashboard
The Dashboard is a single, high-level view into your environment which includes easy-to-read performance and configuration information. In many cases other areas within Morpheus UI will allow you to drill deeper into the information presented in the dashboard.

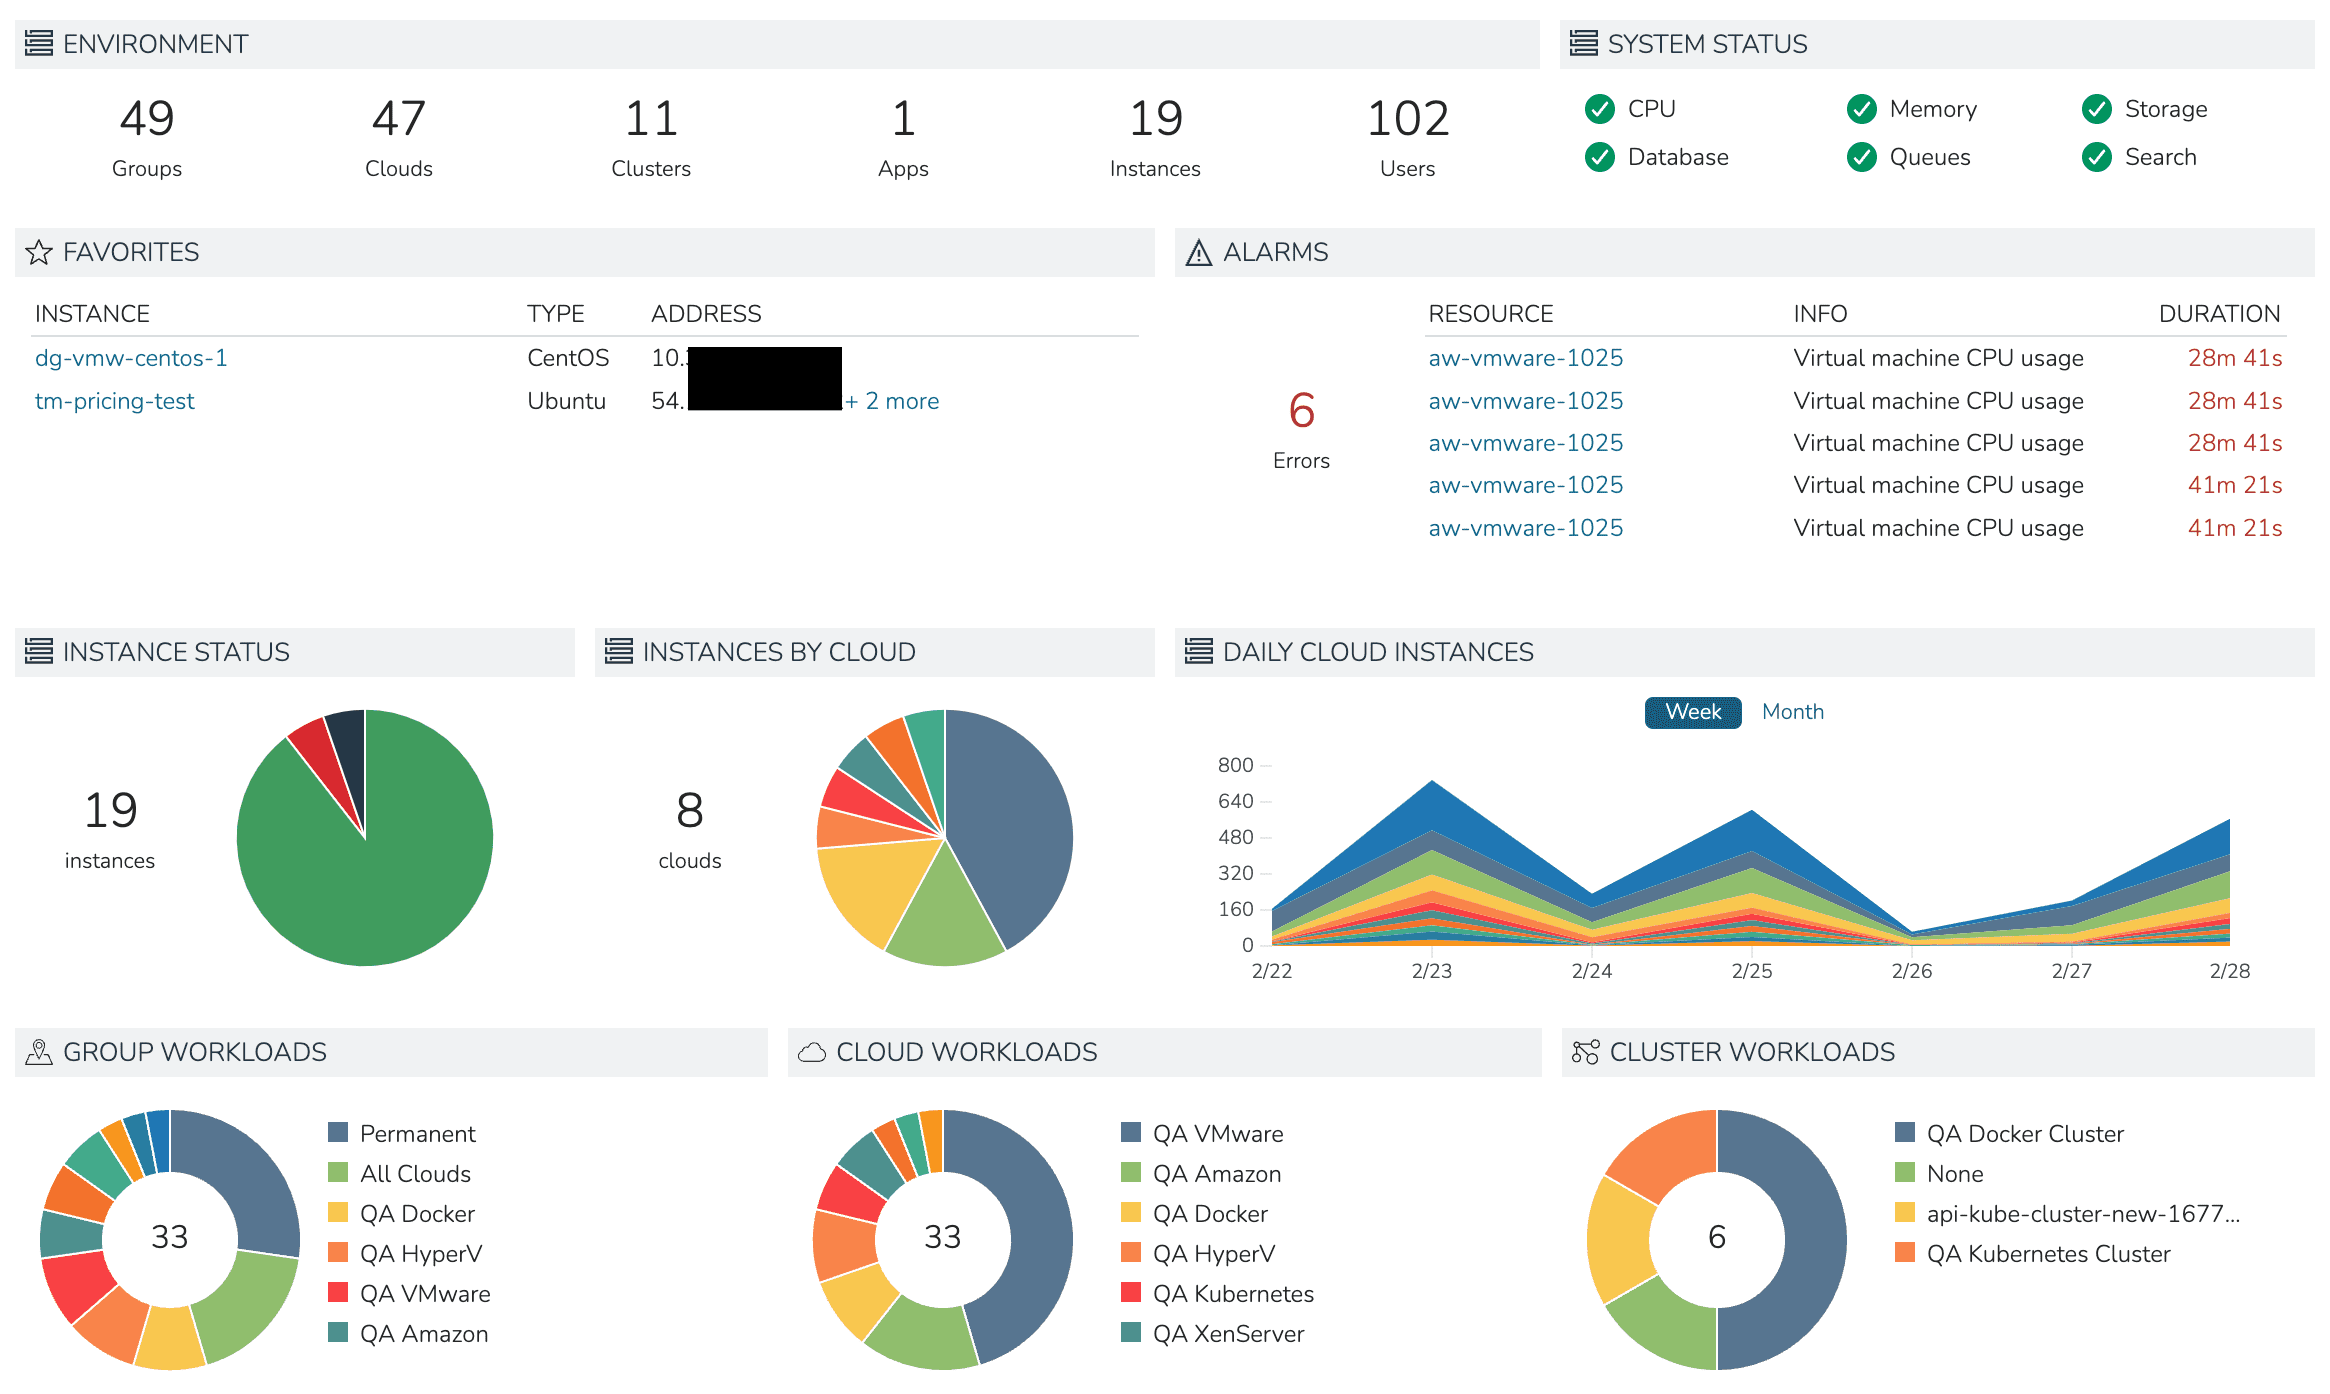
Environment
Groups: Total number of Groups currently created
Clouds: Total number of Clouds currently integrated
Clusters: Total number of clusters currently provisioned
Apps: Total number of Apps currently provisioned
Instances: Total number of Instances currently provisioned
Users: Total number of Morpheus user accounts
System Status
System status gives a high-level view of the health of the appliance. More detailed information can be viewed on the appliance health detail page (Administration > Health) and a more detailed breakdown of the meaning of each status indicator is in Morpheus health documentation.
Favorites
Any Instances you’ve “favorited” will appear here along with the Instance name, type, and IP address
Alarms
The most recent five Alarms are displayed here and the user may link through to the resource which triggered the Alarm. For the complete list of Alarms and more information on each Alarm navigate to Operations > Activity > Alarms
Instance Status
The total number of Instances is listed along with a pie chart showing the statuses of each. Hover over each section of the pie chart to see the total number and percentage of Instances in that state. States may include running, stopped, provisioning, and more
Instances By Cloud
The total number of Clouds which currently have an Instance provisioned is shown. Hover over each section of the pie chart to see the total number and percentage of Instances provisioned to each Cloud
Daily Cloud Instances
The number of Instances that have existed at any point in the day with additional breakdown to show the number provisioned to each Cloud. This number will include any pre-existing Instances which have carried over from previous days along with any new Instances that were provisioned and existed on that day even for a short time
Group Workloads
The instantaneous count of host or container records broken down by Group association
Cloud Workloads
The instantaneous count of host or container records broken down by Cloud association
Cluster Workloads
The instantaneous count of managed containers broken down by Cluster association

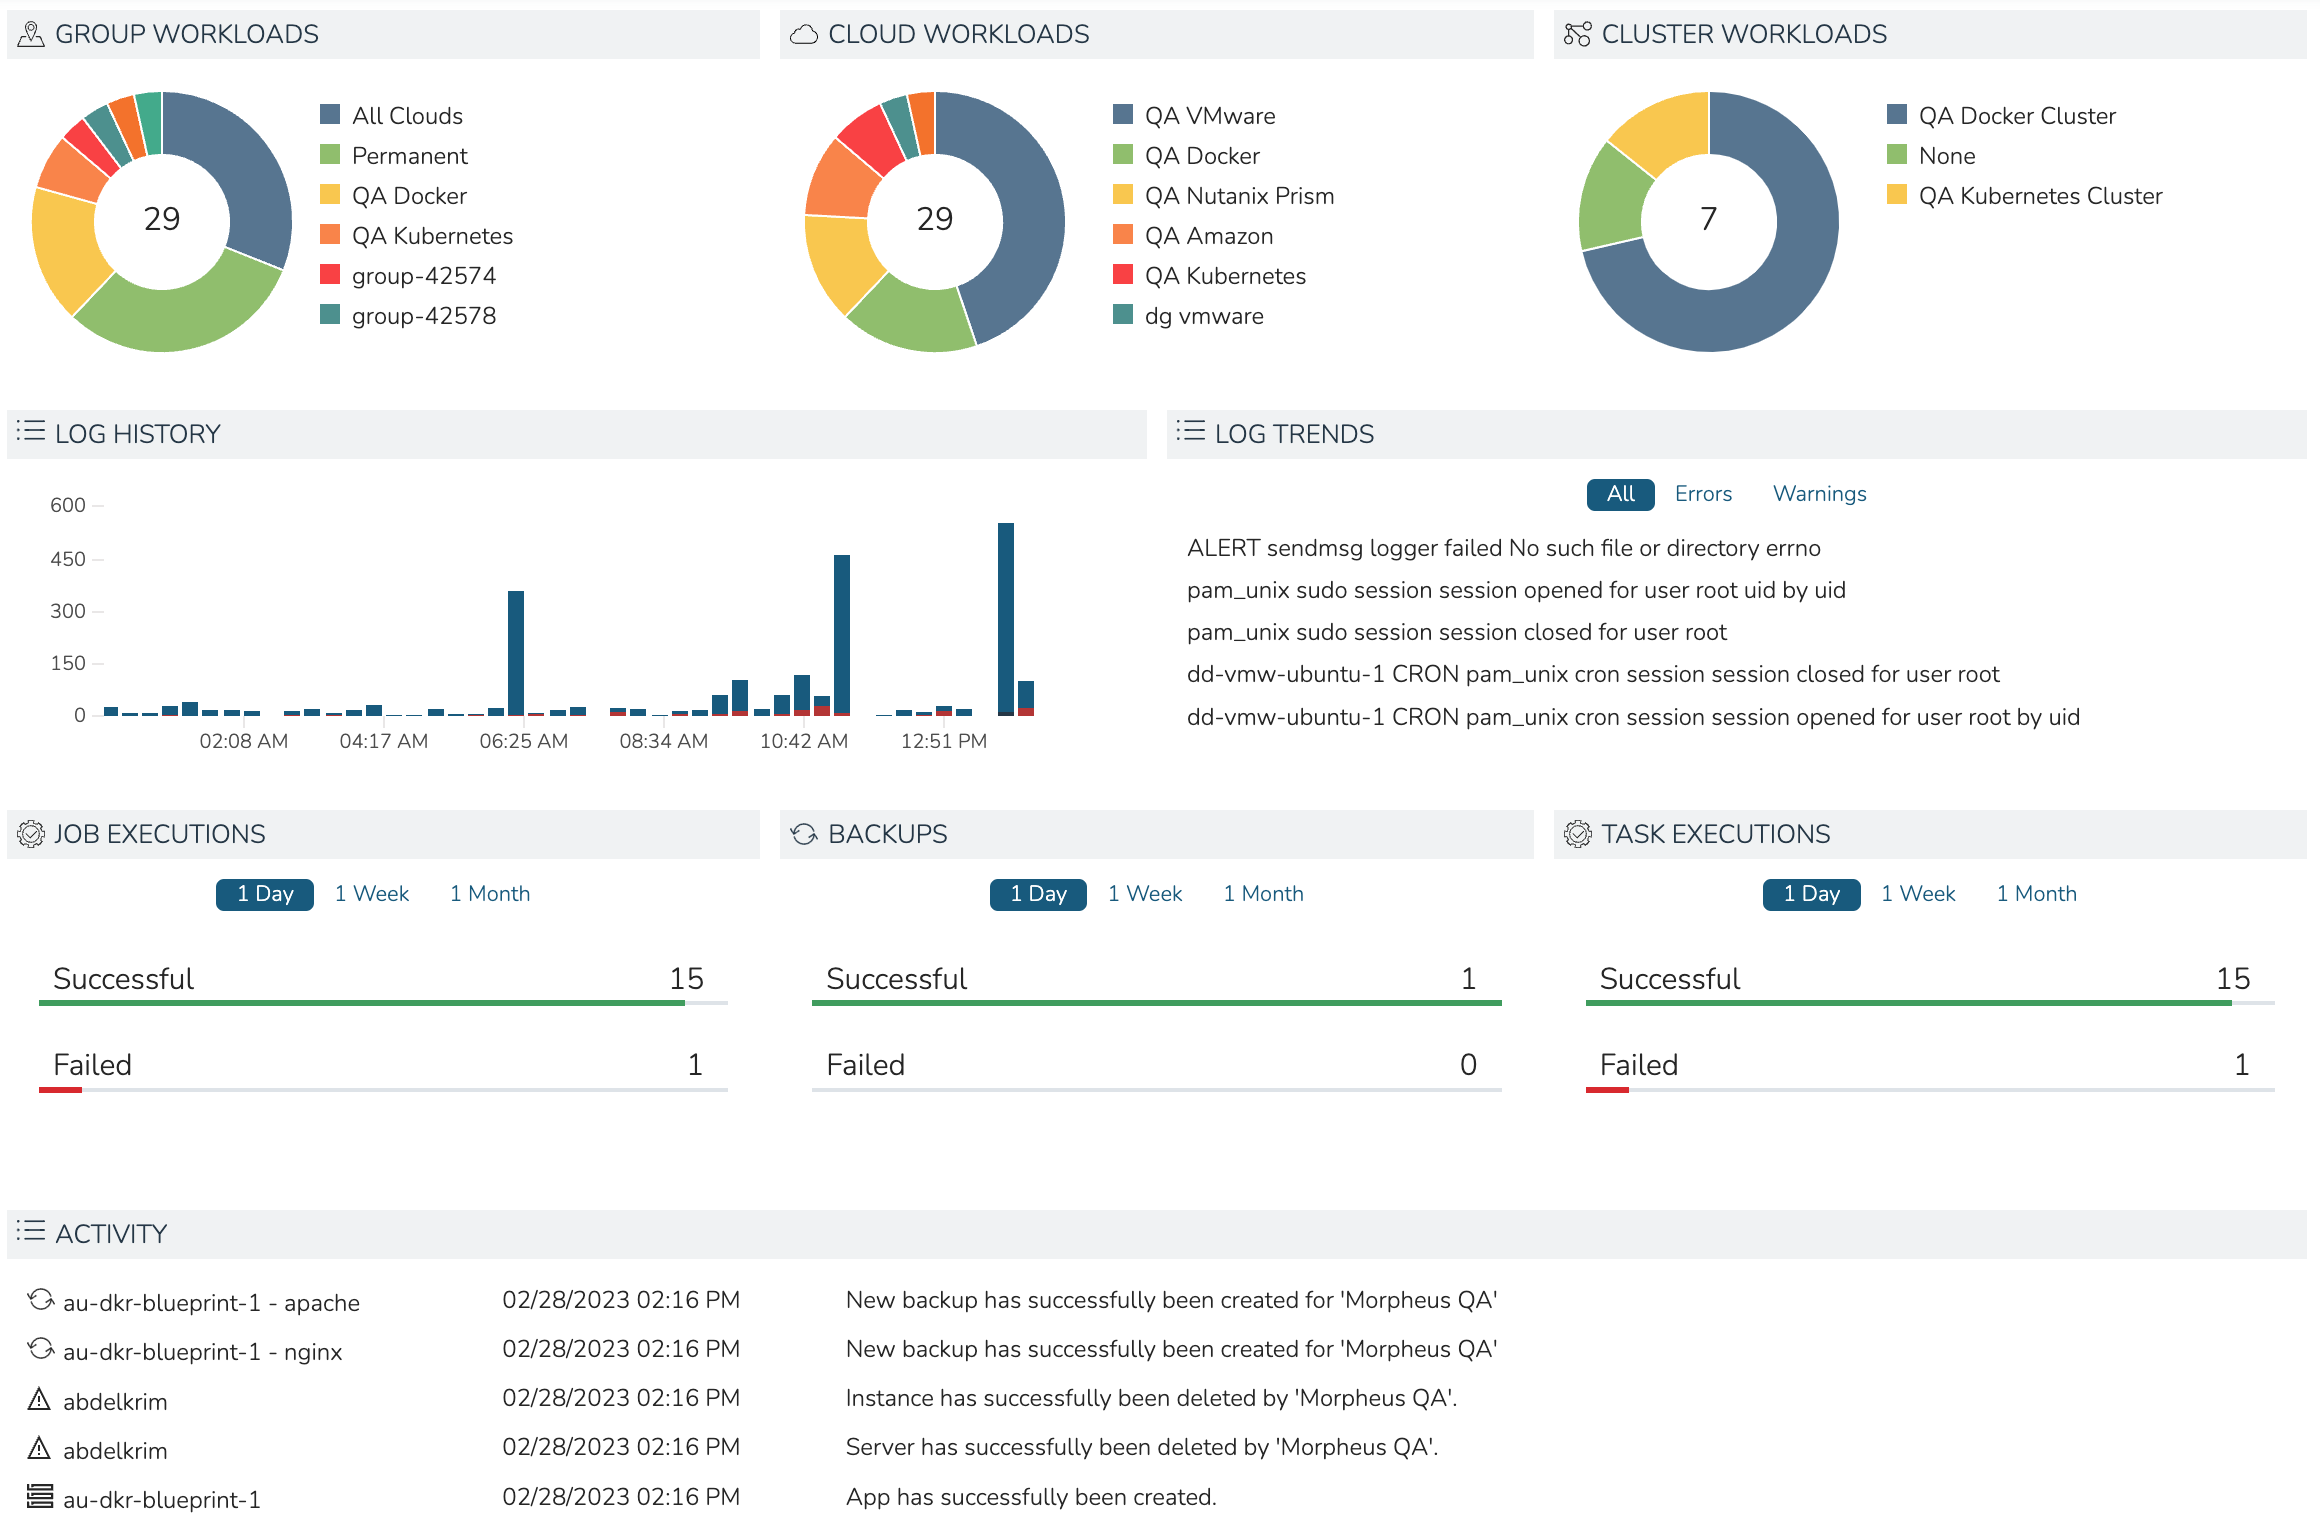
Log History
Log History shows a snapshot of various time segments throughout the current day and the number of logs generated during each segment. Hover over any bar on the graph to see a breakdown in severity of the logs within each segment
Log Trends
Log Trends identifies and lists repeated messages found in recent longs. If desired, this view can be filtered to show only Error or Warning-level log messages
Job Executions
Displays the number of successful and unsuccessful Job executions over the last day, week or month
Backups
Displays the number of successful and unsuccessful backups over the last day, week or month
Task Executions
Displays the number of successful and unsuccessful Task executions over the last day, week or month
Activity
The activity list displays the last few events that have taken place in Morpheus by any user. This could be new provisioned workloads, deleted workloads, backups, or a number of other things. A more complete list of recent activities can be viewed in Operations > Activity