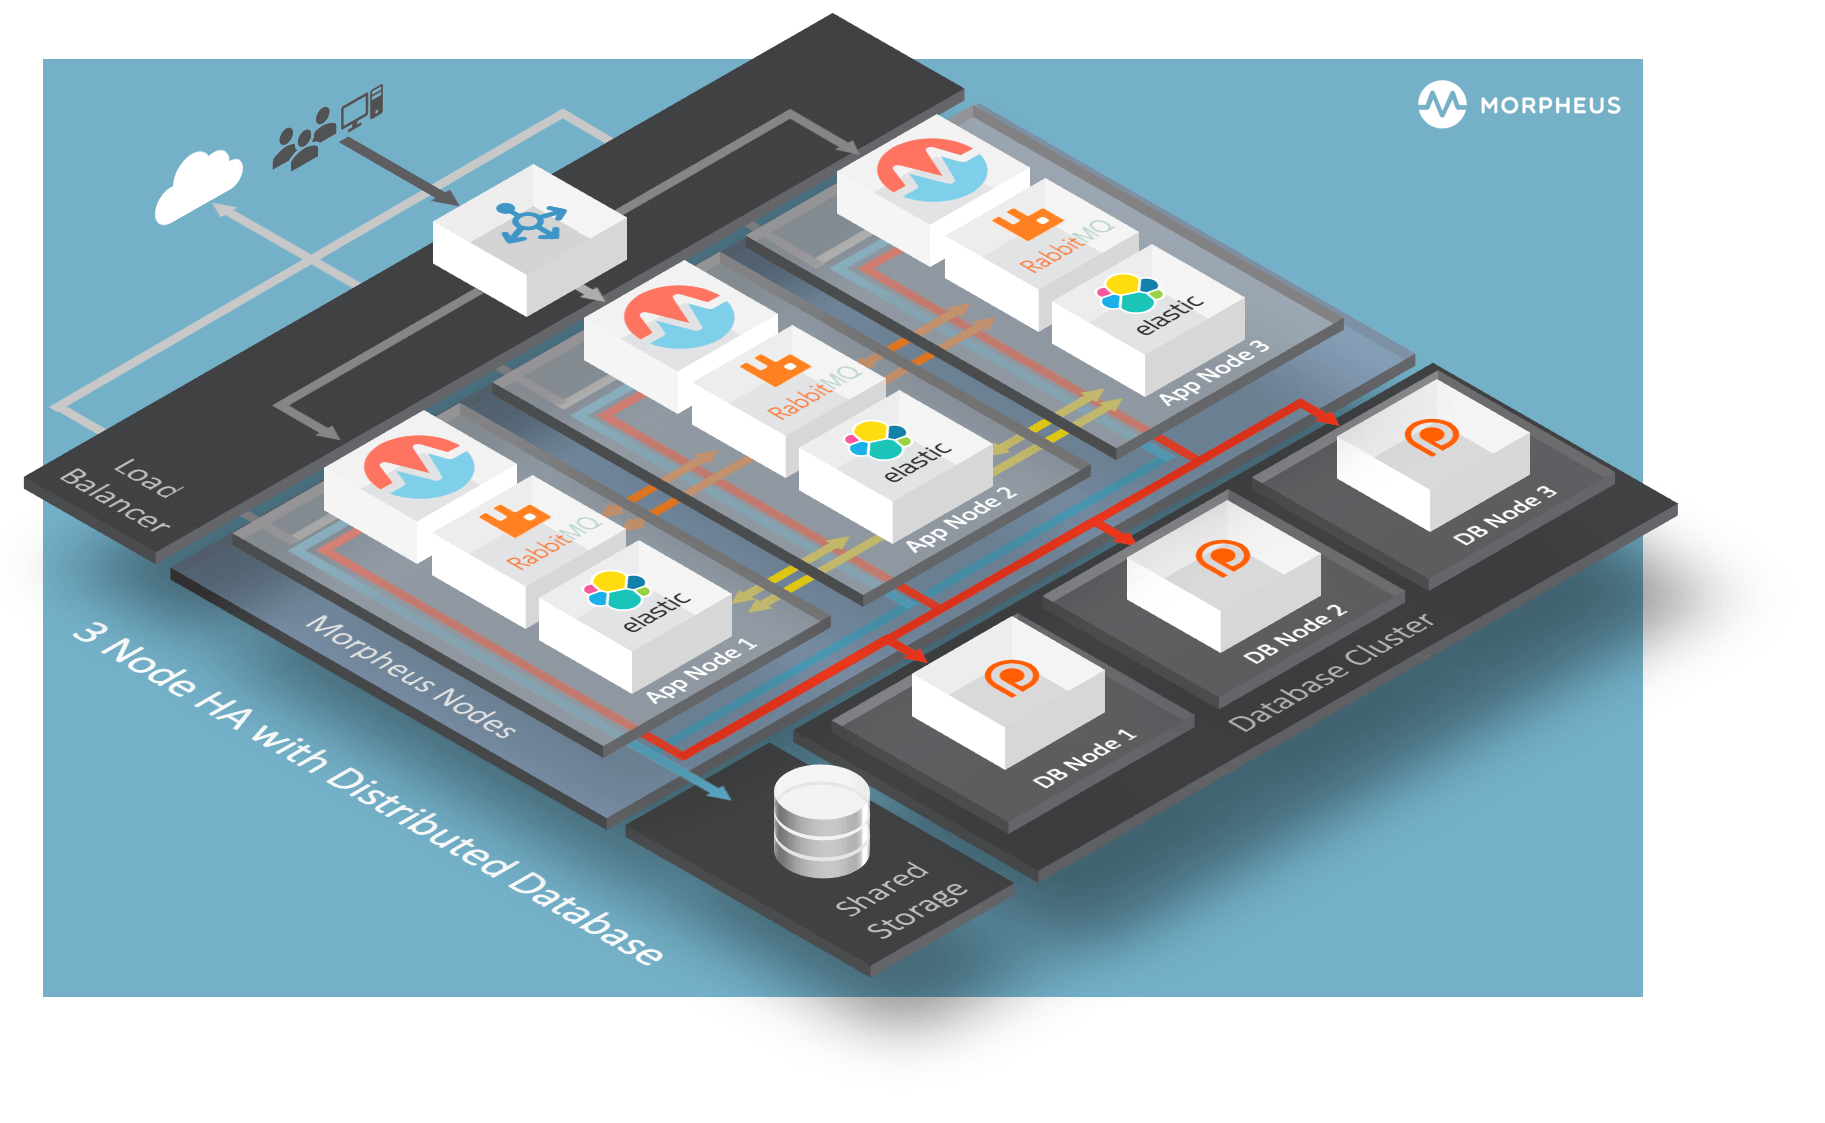
3-Node HA Install
Distributed App Nodes with Externalized DB
Assumptions
This guide assumes the following:
The Baremetal nodes cannot access the public internet
The base OS is RHEL 7.x
Shortname versions of hostnames will be resolvable
All nodes have access to a shared volume for
/var/opt/morpheus/morpheus-ui. This can be done as a post startup step.This configuration will support the complete loss of a single node, but no more. Specifically the Elasticsearch tier requires at least two nodes to always be clustered..
Default Locations
Morpheus follows several install location conventions. Below is a list of system defaults for convenient management:
Installation Location:
/opt/morpheusLog Location:
/var/log/morpheusMorpheus-UI:
/var/log/morpheus/morpheus-uiNginX:
/var/log/morpheus/nginxCheck Server:
/var/log/morpheus/check-serverElastic Search:
/var/log/morpheus/elasticsearchRabbitMQ:
/var/log/morpheus/rabbitmq
User-defined install/config:
/etc/morpheus/morpheus.rb
CentOS/RHEL Percona XtraDB Cluster with TLS
Out of the box Morpheus uses MySQL but Morpheus supports any mySQL-compliant database. There are many ways to set up a highly available, MySQL dialect-based database. One which has found favor with many of our customers is Percona’s XtraDB Cluster. Percona’s product is based off of Galera’s WSREP Clustering, which is also supported.
Important
Currently, you must use a v5.7-compatible version of MySQL/Percona. Complete compatibility information is available in the Compatibility and Breaking Changes page. Additional configuration for Percona Clusters with TLS enabled is required. Refer to CentOS/RHEL Percona XtraDB Cluster with TLS Configuration in our full HA docs for details.
Installation and configuration of Percona XtraDB Cluster on CentOS/RHEL 8 with TLS enabled for all communication. Refer to Debian/Ubuntu Percona XtraDB Cluster with TLS for Debian/Ubuntu.
Important
This is a sample configuration only. Customer configurations and requirements will vary.
Additional information can be found here:
Requirements
Storage Requirements
30 GB storage minimum for each database node. This should be monitored and increased if the Morpheus database requires more space.
After database installation ensure that the minimum storage requirement is available for the mysql tmpdir. By default mysql will write temporary files in “/tmp”. The mysql tmpdir configuration can be modified using the following steps for each database node:
Create the new directory.
mkdir /path/to/mysql/tmp/directory
chown -R mysql:mysql /path/to/mysql/tmp/directory
Edit /etc/my.cnf.
[mysqld]
tmpdir=/path/to/mysql/tmp/directory
Important
Failing to provide sufficient storage to the mysql tmpdir can result in failed database migrations and Morpheus upgrades.
Current Operating System (OS) support can be found here:
Percona requires the following TCP ports for the cluster nodes. Please create the appropriate firewall rules on your Percona nodes.
3306
4444
4567
4568
[root]# firewall-cmd --add-port={3306/tcp,4444/tcp,4567/tcp,4568/tcp}
The following OS repositories are required, in addition to the Percona repositories:
rhel-8-for-x86_64-baseos-rpms
rhel-8-for-x86_64-appstream-rpms
Configure SElinux
Percona recommends setting SELinux from enforcing to permissive to eliminate interference. Run the following to set SELinux to permissive on each database node:
[root]# setenforce 0
[root]# sed -i 's/SELINUX=enforcing/SELINUX=permissive/g' /etc/selinux/config
If enforcing is required by the organization, SELinux rules can be added to ensure interference is eliminated. To allow Percona XtraDB Cluster functionality when SELinux is Enforcing, run the following on each database Node:
Install SELinux utilities
[root]# yum install -y policycoreutils-python.x86_64
Configure Percona ports for SELinux:
[root]# semanage port -m -t mysqld_port_t -p tcp 4444
[root]# semanage port -m -t mysqld_port_t -p tcp 4567
[root]# semanage port -a -t mysqld_port_t -p tcp 4568
Create the policy file PXC.te
[root]# vi PXC.te
module PXC 1.0;
require {
        type unconfined_t;
        type mysqld_t;
        type unconfined_service_t;
        type tmp_t;
        type sysctl_net_t;
        type kernel_t;
        type mysqld_safe_t;
        class process { getattr setpgid };
        class unix_stream_socket connectto;
        class system module_request;
        class file { getattr open read write };
        class dir search;
  }

  #============= mysqld_t ==============

 allow mysqld_t kernel_t:system module_request;
 allow mysqld_t self:process { getattr setpgid };
 allow mysqld_t self:unix_stream_socket connectto;
 allow mysqld_t sysctl_net_t:dir search;
 allow mysqld_t sysctl_net_t:file { getattr open read };
 allow mysqld_t tmp_t:file write;
Compile and load the SELinux policy
[root]# checkmodule -M -m -o PXC.mod PXC.te
[root]# semodule_package -o PXC.pp -m PXC.mod
[root]# semodule -i PXC.pp
Add Percona Repo
Additional information can be found here:
percona-release Repository Locations
Add the Percona repo to your Linux Distro.
[root]# yum install -y https://repo.percona.com/yum/percona-release-latest.noarch.rpm
[root]# percona-release setup pxc-57
The below commands will clean the repos and update the server.
[root]# yum clean all
[root]# yum update -y --skip-broken
Installing Percona XtraDB Cluster
Install the Percona XtraDB Cluster software and it’s dependences on each database node.
[root]# yum install -y Percona-XtraDB-Cluster-57
Enable the mysql service so that the service starts at boot on each database node.
[root]# systemctl enable mysql
Start mysql on each database node.
[root]# systemctl start mysql
From Node 01, log into the mysql server and set a new root password. To get the temporary root mysql password you will need to run the below command. The command will print the password to the screen. Copy the password and use it when logging in.
[root]# grep 'temporary password' /var/log/mysqld.log
[root]# mysql -u root -p
   password: `enter password copied above`
Change the root user password to the mysql DB. Note that the database from Node 1 will be replicated to all other nodes, changing the password on the additional nodes is not required.
mysql> ALTER USER 'root'@'localhost' IDENTIFIED BY 'rootPassword';
Create the sstuser user, grant the permissions, and exit mysql.
mysql> CREATE USER 'sstuser'@'localhost' IDENTIFIED BY 'sstUserPassword';
Note
The sstuser and password will be used in the /etc/my.cnf configuration.
mysql> GRANT RELOAD, LOCK TABLES, PROCESS, REPLICATION CLIENT ON *.* TO 'sstuser'@'localhost';

mysql> FLUSH PRIVILEGES;

mysql> exit
Bye
Stop the mysql service on all nodes
[root]# systemctl stop mysql
Once the service is stopped on all nodes move onto the next step.
Add [mysqld] to my.cnf in /etc/
Add the following to
/etc/my.cnf. Thewsrep_node_nameandwsrep_node_addressfields must to be unique on each of the nodes. Thewsrep_sst_authfield should match the SST username and password created previously.DB Node 1
[root]# vi /etc/my.cnf

[mysqld]
pxc_encrypt_cluster_traffic=ON
max_connections = 451
max_allowed_packet = 256M

wsrep_provider=/usr/lib64/galera3/libgalera_smm.so
wsrep_provider_options="cert.optimistic_pa=NO"
wsrep_certification_rules='OPTIMIZED'

wsrep_cluster_name=morpheusdb-cluster
wsrep_cluster_address=gcomm://192.168.101.01,192.168.101.02,192.168.101.03

wsrep_node_name=morpheus-db-node01
wsrep_node_address=192.168.101.01

wsrep_sst_method=xtrabackup-v2
wsrep_sst_auth=sstuser:sstUserPassword
pxc_strict_mode=PERMISSIVE
wsrep_sync_wait=2

skip-log-bin
default_storage_engine=InnoDB
innodb_autoinc_lock_mode=2
character-set-server=utf8
default_time_zone="+00:00"
DB Node 2
[root]# vi /etc/my.cnf

[mysqld]
pxc_encrypt_cluster_traffic=ON
max_connections = 451
max_allowed_packet = 256M

wsrep_provider=/usr/lib64/galera3/libgalera_smm.so
wsrep_provider_options="cert.optimistic_pa=NO"
wsrep_certification_rules='OPTIMIZED'

wsrep_cluster_name=morpheusdb-cluster
wsrep_cluster_address=gcomm://192.168.101.01,192.168.101.02,192.168.101.03

wsrep_node_name=morpheus-db-node02
wsrep_node_address=192.168.101.02

wsrep_sst_method=xtrabackup-v2
wsrep_sst_auth=sstuser:sstUserPassword
pxc_strict_mode=PERMISSIVE
wsrep_sync_wait=2

skip-log-bin
default_storage_engine=InnoDB
innodb_autoinc_lock_mode=2
character-set-server=utf8
default_time_zone="+00:00"
DB Node 3
[root]# vi /etc/my.cnf

[mysqld]
pxc_encrypt_cluster_traffic=ON
max_connections = 451
max_allowed_packet = 256M

wsrep_provider=/usr/lib64/galera3/libgalera_smm.so
wsrep_provider_options="cert.optimistic_pa=NO"
wsrep_certification_rules='OPTIMIZED'

wsrep_cluster_name=morpheusdb-cluster
wsrep_cluster_address=gcomm://192.168.101.01,192.168.101.02,192.168.101.03

wsrep_node_name=morpheus-db-node03
wsrep_node_address=192.168.101.03

wsrep_sst_method=xtrabackup-v2
wsrep_sst_auth=sstuser:sstUserPassword
pxc_strict_mode=PERMISSIVE
wsrep_sync_wait=2

skip-log-bin
default_storage_engine=InnoDB
innodb_autoinc_lock_mode=2
character-set-server=utf8
default_time_zone="+00:00"
Note
The default setting on Morpheus app nodes for
max_activedatabase connections is 150. For this example we are settingmax_connections = 451to account for 3 maximum simultaneous Morpheus app node connections. Ifmax_activeis configured higher on the app nodes, or the number of app nodes is not 3, adjust accordingly for your configuration.Save
/etc/my.cnf
Bootstrap Node 01
Important
Ensure mysql.service is stopped prior to bootstrap.
To bootstrap the first node in the cluster run the below command.
systemctl start [email protected]
Note
The mysql service will start during the bootstrap.
Note
Startup failures are commonly caused by misconfigured
/etc/my.cnffiles. Also verifysafe_to_bootstrapis set to1on Node 01 in/var/lib/mysql/grastate.dat.
Configure Morpheus Database and User
Create the Database you will be using with Morpheus. Login to mysql on Node 01:
[root]# mysql -u root -p
  password: `enter root password`

mysql> CREATE DATABASE morpheus CHARACTER SET utf8 COLLATE utf8_general_ci;

mysql> show databases;
Next create your Morpheus database user. This is the user the Morpheus app nodes will auth with mysql.
mysql> CREATE USER 'morpheusDbUser'@'%' IDENTIFIED BY 'morpheusDbUserPassword';
Next Grant your new Morpheus user permissions.
mysql> GRANT ALL PRIVILEGES ON *.* TO 'morpheusDbUser'@'%' IDENTIFIED BY 'morpheusDbUserPassword';

mysql> FLUSH PRIVILEGES;
Important
If you grant privileges to the morpheusDbUser to only the morpheusdb database, you will also need to GRANT SELECT, PROCESS, SHOW DATABASES, SUPER ON PRIVILEGES to the morpheusDbUser on . for the Appliance Health service.
mysql> exit
Copy SSL Files to other nodes
During initialization of Node 01 the required pem files will be generated in /var/lib/mysql. The ca.pem, server-cert.pem and server-key.pem files need to match on all nodes in the cluster.
Copy the following files from Node 01 to the same path (default is /var/lib/mysql) on Node 02 and Node 03:
From Node 01
[root]# scp /var/lib/mysql/ca.pem [email protected]:/root
[root]# scp /var/lib/mysql/server-cert.pem [email protected]:/root
[root]# scp /var/lib/mysql/server-key.pem [email protected]:/root

[root]# scp /var/lib/mysql/ca.pem [email protected]:/root
[root]# scp /var/lib/mysql/server-cert.pem [email protected]:/root
[root]# scp /var/lib/mysql/server-key.pem [email protected]:/root
From Node 02 and Node 03
[root]# cp /root/ca.pem /var/lib/mysql/
[root]# cp /root/server-cert.pem /var/lib/mysql/
[root]# cp /root/server-key.pem /var/lib/mysql/
Important
Ensure all 3 files match on all 3 nodes, including path, owner and permissions.
Note
The generated certificate is self-signed. Consult Percona documentation for [mysqld] and SSL file configuration when providing your own.
Start the Remaining Nodes
Start mysql on Node 02 and Node 03
[root]# systemctl start mysql
The services will automatically join the cluster using the sstuser we created earlier.
Note
Startup failures are commonly caused by misconfigured /etc/my.cnf files.
Verify Configuration
Verify SELinux is not rejecting any db cluster communication by running the below on all db nodes:
[root@allDbNodes]# grep -i denied /var/log/audit/audit.log | grep mysqld_t
If there are any results, address the source or update the SELinux Policy to resolve.
Update SELinux if necessary
[root@allDbNodes]# rm -f PXC.*
[root@allDbNodes]# grep -i denied /var/log/audit/audit.log | grep mysqld_t | audit2allow -M PXC
[root@allDbNodes]# semodule -i PXC.pp
To verify all nodes joined the cluster, on any db node login to mysql and run
show status like 'wsrep%';[root@anyDbNode]# mysql -u root -p mysql> show status like 'wsrep%';
Verify
wsrep_cluster_sizeis3andwsrep_incoming_addresseslists all 3 node ip addresses.From all Morpheus app nodes, verify that you can login to all 3 database nodes
[root@allAppNodes] cd /opt/morpheus/embedded/bin/
[root@appNode01]# ./mysql -h 192.168.101.01 -u morpheusDbUser -p
[root@appNode02]# ./mysql -h 192.168.101.02 -u morpheusDbUser -p
[root@appNode03]# ./mysql -h 192.168.101.03 -u morpheusDbUser -p
If you are unable to login to mysql from an app node, ensure credentials are correct, privileges have been granted, mysql is running, and ports are open.
To validate network accessibility, use telnet to verify app node can reach db nodes on 3306: telnet 192.168.101.01 3306
App Node Installation
First begin by downloading and installing the requisite Morpheus packages to the Morpheus nodes.
Note
For offline or nodes that cannot reach https://downloads.morpheusdata.com, both the standard and supplemental packages will need to be transferred and then installed on the Morpheus nodes.
All Nodes
[root@node-(1/2/3) ~]# wget https://example/path/morpheus-appliance-ver-1.el7.x86_64.rpm
[root@node-(1/2/3) ~]# rpm -i morpheus-appliance-offline-ver-1.noarch.rpm
Do NOT run reconfigure yet. The Morpheus configuration file must be edited prior to the initial reconfigure.
Next you will need to edit the Morpheus configuration file
/etc/morpheus/morpheus.rbon each node.Node 1
appliance_url 'https://morpheus1.localdomain'
elasticsearch['es_hosts'] = {'10.100.10.121' => 9200, '10.100.10.122' => 9200, '10.100.10.123' => 9200}
elasticsearch['node_name'] = '10.100.10.121'
elasticsearch['host'] = '0.0.0.0'
rabbitmq['host'] = '0.0.0.0'
rabbitmq['nodename'] = 'rabbit@node01'
mysql['enable'] = false
mysql['host'] = '10.100.10.111'
mysql['morpheus_db'] = 'morpheusdb'
mysql['morpheus_db_user'] = 'morpheus'
mysql['morpheus_password'] = 'password'
Node 2
appliance_url 'https://morpheus2.localdomain'
elasticsearch['es_hosts'] = {'10.100.10.121' => 9200, '10.100.10.122' => 9200, '10.100.10.123' => 9200}
elasticsearch['node_name'] = '10.100.10.122'
elasticsearch['host'] = '0.0.0.0'
rabbitmq['host'] = '0.0.0.0'
rabbitmq['nodename'] = 'rabbit@node02'
mysql['enable'] = false
mysql['host'] = '10.100.10.111'
mysql['morpheus_db'] = 'morpheusdb'
mysql['morpheus_db_user'] = 'morpheus'
mysql['morpheus_password'] = 'password'
Node 3
appliance_url 'https://morpheus3.localdomain'
elasticsearch['es_hosts'] = {'10.100.10.121' => 9200, '10.100.10.122' => 9200, '10.100.10.123' => 9200}
elasticsearch['node_name'] = '10.100.10.123'
elasticsearch['host'] = '0.0.0.0'
rabbitmq['host'] = '0.0.0.0'
rabbitmq['nodename'] = 'rabbit@node03'
mysql['enable'] = false
mysql['host'] = '10.100.10.111'
mysql['morpheus_db'] = 'morpheusdb'
mysql['morpheus_db_user'] = 'morpheus'
mysql['morpheus_password'] = 'password'
Important
The elasticsearch node names set in
elasticsearch['node_name']must match the host entries in elasticsearch[‘es_hosts’].node_nameis used fornode.nameandes_hostsis used forcluster.initial_master_nodesin the generated elasticsearch.yml config. Node names that do not match entries in cluster.initial_master_nodes will cause clustering issues.Reconfigure on all nodes
All Nodes
[root@node-[1/2/3] ~] morpheus-ctl reconfigure
Morpheus will come up on all nodes and Elasticsearch will auto-cluster. The only item left is the manual clustering of RabbitMQ.
Clustering RabbitMQ
Select one of the nodes to be your Source Of Truth (SOT) for RabbitMQ clustering (Node 1 for this example). On the nodes that are NOT the SOT (Nodes 2 & 3 in this example), begin by stopping the UI and RabbitMQ.
Node 2
[root@node-2 ~] morpheus-ctl stop morpheus-ui
[root@node-2 ~] source /opt/morpheus/embedded/rabbitmq/.profile
[root@node-2 ~] rabbitmqctl stop_app
[root@node-2 ~] morpheus-ctl stop rabbitmq
Node 3
[root@node-3 ~] morpheus-ctl stop morpheus-ui
[root@node-3 ~] source /opt/morpheus/embedded/rabbitmq/.profile
[root@node-3 ~] rabbitmqctl stop_app
[root@node-3 ~] morpheus-ctl stop rabbitmq
Then on the SOT node, we need to copy the secrets for RabbitMQ.
Begin by copying secrets from the SOT node to the other nodes.
Node 1
[root@node-1 ~] cat /etc/morpheus/morpheus-secrets.json

 "rabbitmq": {
   "morpheus_password": "***REDACTED***",
   "queue_user_password": "***REDACTED***",
   "cookie": "***REDACTED***"
 },
Node 2
[root@node-2 ~] vi /etc/morpheus/morpheus-secrets.json

  "rabbitmq": {
    "morpheus_password": "***node-1_morpheus_password***",
    "queue_user_password": "***node-1_queue_user_password***",
    "cookie": "***node-1_cookie***"
  },
Node 3
[root@node-3 ~] vi /etc/morpheus/morpheus-secrets.json

"rabbitmq": {
  "morpheus_password": "***node-1_morpheus_password***",
  "queue_user_password": "***node-1_queue_user_password***",
  "cookie": "***node-1_cookie***"
},
Then copy the erlang.cookie from the SOT node to the other nodes
Node 1
[root@node-1 ~] cat /opt/morpheus/embedded/rabbitmq/.erlang.cookie

# 754363AD864649RD63D28
Node 2
[root@node-2 ~] vi /opt/morpheus/embedded/rabbitmq/.erlang.cookie

# node-1_erlang_cookie
Nodes 3
[root@node-3 ~] vi /opt/morpheus/embedded/rabbitmq/.erlang.cookie

# node-1_erlang_cookie
Once the secrets and cookie are copied from node-1 to nodes 2 & 3, run a reconfigure on nodes 2 & 3.
Node 2
[root@node-2 ~] morpheus-ctl reconfigure
Node 3
[root@node-3 ~] morpheus-ctl reconfigure
Next we will join nodes 2 & 3 to the cluster.
Important
The commands below must be run at root
Node 2
[root@node-2 ~]# morpheus-ctl stop rabbitmq
[root@node-2 ~]# morpheus-ctl start rabbitmq
[root@node-2 ~]# source /opt/morpheus/embedded/rabbitmq/.profile
[root@node-2 ~]# rabbitmqctl stop_app

Stopping node 'rabbit@node-2' ...

[root@node-2 ~]# rabbitmqctl join_cluster rabbit@node-1

Clustering node 'rabbit@node-2' with 'rabbit@node-1' ...

[root@node-2 ~]# rabbitmqctl start_app

Starting node 'rabbit@node-2' ...

[root@node-2 ~]#
Node 3
[root@node-3 ~]# morpheus-ctl stop rabbitmq
[root@node-3 ~]# morpheus-ctl start rabbitmq
[root@node-3 ~]# source /opt/morpheus/embedded/rabbitmq/.profile
[root@node-3 ~]# rabbitmqctl stop_app

Stopping node 'rabbit@node-3' ...

[root@node-3 ~]# rabbitmqctl join_cluster rabbit@node-1

Clustering node 'rabbit@node-3' with 'rabbit@node-1' ...

[root@node-3 ~]# rabbitmqctl start_app

Starting node 'rabbit@node-3' ...

[root@node-3 ~]#
Note
If you receive an error
unable to connect to epmd (port 4369) on node-1: nxdomain (non-existing domain)make sure to add all IPs and short (non-fqdn) hostnames to theetc/hostsfile to ensure each node can resolve the other hostnames.Next reconfigure Nodes 2 & 3
Node 2
[root@node-2 ~] morpheus-ctl reconfigure
Node 3
[root@node-3 ~] morpheus-ctl reconfigure
The last thing to do is start the Morpheus UI on the two nodes that are NOT the SOT node.
Node 2
[root@node-2 ~] morpheus-ctl start morpheus-ui
Node 3
[root@node-3 ~] morpheus-ctl start morpheus-ui
You will be able to verify that the UI services have restarted properly by inspecting the logfiles. A standard practice after running a restart is to tail the UI log file.
root@node-1/2/3 ~]# morpheus-ctl tail morpheus-ui
Load Balancer Configuration
For configurations with 2 or more Applications Nodes, a load balancer is recommended to ensure high availability (HA) from disruptions and upgrades. Below are the guidelines to configuring a load balancer for Morpheus but each configuration may differ based on the organization’s requirements.
Requirements
WebSockets enabled
Load Balance 443 (optionally redirect 80 to 443)
SSL Termination (Offload), Bridging, and Passthrough are supported
Round-Robin or least connection distribution
Persistence/sticky sessions configured
HTTPS monitor
https://ip_address/pingbody forMORPHEUS PINGor status of 200, for node operational health
Example configurations
Below are a few examples of configuring load balancers to meet the needs of a HA configuration. The examples assume SSL bridging will be used, which means an SSL (TLS) certificate is presented by the load balancer to clients and the load balancer will communicate with the backend nodes via a different (possibly same) certificate. This configuration is recommended because the Morpheus application nodes will create self-signed certificates and the load balancer will present a valid certificate to end users. Additionally, all communication will be encrypted. This reduces the overhead of maintaining the certificates on the Morpheus application nodes, as the load balancer can ignore invaild certs on the application nodes. However, the certificates on the Morpheus application nodes are not required to be self-signed, they can be replaced with other trusted certificates following the SSL Certificates documentation.
Tip
The list below is not meant to be a complete list for all load balancers. The provided examples are common deployments that can be used for reference. The settings mentioned in the examples list the primary settings that may need to be configured, other settings are based on the organization’s needs requirements and own configuration.
F5 BIG-IP
Monitor
Type: HTTPS
Send String: GET /ping
Receive String: MORPHEUS PING
Pool
Health Monitor: Select monitor created in the Monitor section
Load Balancing Method: Least Connections (member) is recommended (alternatively Round Robin)
Node Service Port: 443/HTTPS
Virtual Server
Type: Standard
Service Port: 443/HTTPS
Protocol: TCP
Protocol Profile (Client): tcp
Protocol Profile (Server): tcp
HTTP Profile (Client): http
HTTP Profile (Server): http
SSL Profile (Client): clientssl (or preferred profile with a trusted certificate)
SSL Profile (Server): serverssl
Source Address Translation: Auto Map
Default Persistence Profile: <Organization’s preference> (hash, source_addr, and cookie are popular)
AWS Application Load Balancer (ALB)
Target Group
Target Type: Instances
Protocol/Port: HTTPS/443
Health Check Protocol: HTTPS
Health check path: /ping
Load balancing algorithm: Least Outstanding Requests is recommended (alternatively Round Robin)
Stickiness Type: Load balancer generated cookie
Load Balancer
Security Group: Allow HTTPS/443 Inbound and Outbound
Listener: HTTPS:443 to the target group created in the Target Group section
Security Policy: ELBSecurityPolicy-2016-08
Database Migration
If your new installation is part of a migration then you need to move the data from your original Morpheus database to your new one. This is easily accomplished by using a stateful dump.
To begin this, stop the Morpheus UI on your original Morpheus server:
[root@node-old ~]# morpheus-ctl stop morpheus-ui
Once this is done you can safely export. To access the MySQL shell we will need the password for the Morpheus DB user. We can find this in the morpheus-secrets file:
[root@node-old ~]# cat /etc/morpheus/morpheus-secrets.json

  {
    "mysql": {
        "root_password": "***REDACTED***",
        "morpheus_password": "***REDACTED***",
        "ops_password": "***REDACTED***"
          },
    "rabbitmq": {
              "morpheus_password": "***REDACTED***",
              "queue_user_password": "***REDACTED***",
              "cookie": "***REDACTED***"
    },
    "vm-images": {
      "s3": {
          "aws_access_id": "***REDACTED***",
          "aws_secret_key": "***REDACTED***"
        }
      }
  }
Take note of this password as it will be used to invoke a dump. Morpheus provides embedded binaries for this task. Invoke it via the embedded path and specify the host. In this example we are using the Morpheus database on MySQL listening on localhost. Enter the password copied from the previous step when prompted:
[root@node-old ~]# /opt/morpheus/embedded/mysql/bin/mysqldump -u morpheus -h 127.0.0.1 morpheus -p > /tmp/morpheus_backup.sql

Enter password:
This file needs to be pushed to the new Morpheus Installation’s backend. Depending on the GRANTS in the new MySQL backend, this will likely require moving this file to one of the new Morpheus frontend servers.
Once the file is in place it can be imported into the backend. Begin by ensuring the Morpheus UI service is stopped on all of the application servers:
[root@node-1 ~]# morpheus-ctl stop morpheus-ui
[root@node-2 ~]# morpheus-ctl stop morpheus-ui
[root@node-3 ~]# morpheus-ctl stop morpheus-ui
Then you can import the MySQL dump into the target database using the embedded MySQL binaries, specifying the database host, and entering the password for the Morpheus user when prompted:
[root@node-1 ~]# /opt/morpheus/embedded/mysql/bin/mysql -u morpheus -h 10.130.2.38 morpheus -p < /tmp/morpheus_backup.sql
Enter password:
Recovery
If a node happens to crash most of the time Morpheus will start upon boot of the server and the services will self-recover. However, there can be cases where RabbitMQ and Elasticsearch are unable to recover in a clean fashion and require minor manual intervention. Regardless, it is considered best practice when recovering a restart to perform some manual health checks.
[root@node-1 ~]# morpheus-ctl status
run: check-server: (pid 17808) 7714s; run: log: (pid 549) 8401s
run: elasticsearch: (pid 19207) 5326s; run: log: (pid 565) 8401s
run: guacd: (pid 601) 8401s; run: log: (pid 573) 8401s
run: morpheus-ui: (pid 17976) 7633s; run: log: (pid 555) 8401s
run: nginx: (pid 581) 8401s; run: log: (pid 544) 8401s
run: rabbitmq: (pid 17850) 7708s; run: log: (pid 542) 8401s
But, a status can report false positives if, say, RabbitMQ is in a boot loop or Elasticsearch is up, but not able to join the cluster. It is always advisable to tail the logs of the services to investigate their health.
[root@node-1 ~]# morpheus-ctl tail rabbitmq
[root@node-1 ~]# morpheus-ctl tail elasticsearch
To minimize disruption to the user interface, it is advisable to remedy Elasticsearch clustering first. Due to write locking in Elasticsearch it can be required to restart other nodes in the cluster to allow the recovering node to join. Begin by determining which Elasticsearch node became the master during the outage. On one of the two other nodes (not the recovered node):
[root@node-2 ~]# curl localhost:9200/_cat/nodes
node-1 10.100.10.121 7 47 0.21 d * morpheus1
localhost 127.0.0.1 4 30 0.32 d m morpheus2
The master is determined by identifying the row with the ‘*’ in it. SSH to this node (if different) and restart Elasticsearch.
[root@node-1 ~]# morpheus-ctl restart elasticsearch
Go to the other of the two ‘up’ nodes and run the curl command again. If the output contains three nodes then Elasticsearch has been recovered and you can move on to re-clustering RabbitMQ. Otherwise you will see output that contains only the node itself:
[root@node-2 ~]# curl localhost:9200/_cat/nodes
localhost 127.0.0.1 4 30 0.32 d * morpheus2
If this is the case then restart Elasticsearch on this node as well:
[root@node-2 ~]# morpheus-ctl restart elasticsearch
After this you should be able to run the curl command and see all three nodes have rejoined the cluster:
[root@node-2 ~]# curl localhost:9200/_cat/nodes
node-1 10.100.10.121 9 53 0.31 d * morpheus1
localhost 127.0.0.1 7 32 0.22 d m morpheus2
node-3 10.100.10.123 3 28 0.02 d m morpheus3
The most frequent case of restart errors for RabbitMQ is with epmd failing to restart. Morpheus’s recommendation is to ensure the epmd process is running and daemonized by starting it:
[root@node-1 ~]# /opt/morpheus/embedded/lib/erlang/erts-5.10.4/bin/epmd -daemon
And then restarting RabbitMQ:
[root@node-1 ~]# morpheus-ctl restart rabbitmq
And then restarting the Morpheus UI service:
[root@node-1 ~]# morpheus-ctl restart morpheus-ui
Again, it is always advisable to monitor the startup to ensure the Morpheus Application is starting without error:
[root@node-1 ~]# morpheus-ctl tail morpheus-ui
Recovery Thoughts/Further Discussion: If Morpheus UI cannot connect to RabbitMQ, Elasticsearch or the database tier it will fail to start. The Morpheus UI logs can indicate if this is the case.
Aside from RabbitMQ, there can be issues with false positives concerning Elasticsearch’s running status. The biggest challenge with Elasticsearch, for instance, is that a restarted node has trouble joining the ES cluster. This is fine in the case of ES, though, because the minimum_master_nodes setting will not allow the un-joined singleton to be consumed until it joins. Morpheus will still start if it can reach the other two ES hosts, which are still clustered.
The challenge with RabbitMQ is that it is load balanced behind Morpheus for requests, but each Morpheus application server needs to boostrap the RabbitMQ tied into it. Thus, if it cannot reach its own RabbitMQ startup for it will fail.
Similarly, if a Morpheus UI service cannot reach the database, startup will fail. However, if the database is externalized and failover is configured for Master/Master, then there should be ample opportunity for Morpheus to connect to the database tier.
Because Morpheus can start even though the Elasticsearch node on the same host fails to join the cluster, it is advisable to investigate the health of ES on the restarted node after the services are up. This can be done by accessing the endpoint with curl and inspecting the output. The status should be “green” and number of nodes should be “3”:
[root@node-1 ~]# curl localhost:9200/_cluster/health?pretty=true
{
"cluster_name" : "morpheus",
"status" : "green",
"timed_out" : false,
"number_of_nodes" : 3,
"number_of_data_nodes" : 3,
"active_primary_shards" : 110,
"active_shards" : 220,
"relocating_shards" : 0,
"initializing_shards" : 0,
"unassigned_shards" : 0,
"number_of_pending_tasks" : 0,
"number_of_in_flight_fetch" : 0
}
If this is not the case it is worth investigating the Elasticsearch logs to understand why the singleton node is having trouble joining the cluster. These can be found at /var/log/morpheus/elasticsearch/current
Outside of these stateful tiers, the “morpheus-ctl status” command will not output a “run” status unless the service is successfully running. If a stateless service reports a failure to run, the logs should be investigated and/or sent to Morpheus for additional support. Logs for all Morpheus embedded services are found in /var/log/morpheus.