Nutanix Prism Element
Overview
Nutanix Prism Element simplifies datacenter infrastructure by integrating server and storage resources allowing applications to run at scale. Morpheus enhances Nutanix resources by allowing efficient and seamless deployment of virtualized or containerized applications, management of existing brownfield resources in Nutanix Clouds, pricing and cost tracking, and monitoring of running workloads.
Features
Virtual machine provisioning
Brownfield discovery
Containers
Backups / Snapshots
Datastores
Kubernetes
Morpheus costing and pricing
Auto Scaling
Load Balancing
Remote Console for hypervisor hosts and running workloads
Two-way Cloud sync
Lifecycle Management and Resize
Note
Prism Central is currently supported and is maintained as a separate, plugin-based Cloud integration. See the Prism Central plugin page on the Morpheus plugin share site for additional details and access to the plugin. There is also an integration guide for that plugin here in Morpheus UI documentation.
Getting Started
To get started, first confirm that a few prerequisite steps have been completed. The Nutanix cluster should be provisioned and available on the network. In a typical configuration, Nutanix will be available at the https://fqdn:9440 URL. Have the credentials for an administrator service account available to integrate Morpheus with the Nutanix cluster. With those prerequisites already completed, you’re ready to add a Nutanix Cloud to Morpheus using the instructions in the next section.
Adding a Nutanix Cloud
To start, navigate to the Cloud list page (Infrastructure > Clouds) and click + ADD. On the ADD CLOUD modal, you will at least need to provide a NAME for the Cloud in Morpheus along with the API URL and credentials. Other fields listed here are optional but may be needed for the Cloud to perform as desired in your environment.
NAME: A name for the Nutanix Cloud within Morpheus
CODE: A unique code for the cloud which is used in Morpheus API, CLI, and in automation scripts
LABELS: Select or create a new Label to apply to the Cloud. See Labels documentation for a complete description of the usefulness of Labels
LOCATION: An optional description field for the Cloud to hold location information
VISIBILITY: For multitenant environments, sets the visibility level for Tenants outside of the one the Cloud resources are assigned to
TENANT: If the visibility is set to private, this sets the Tenant the Cloud resources are assigned to
ENABLED: When checked, Morpheus will perform regular syncs with this Cloud and the Cloud will also be selectable as a provisioning target
AUTOMATICALLY POWER ON VMS: Indicates whether Morpheus should control the power state for provisioned VMs (not brownfield discovered VMs). If VMs are powered off for an unknown reason (that is, outside of Morpheus) they will be powered back on. Leave unchecked if you wish to manage workload power state outside of Morpheus
API URL: The URL for the Nutanix Prism API, typically in a format like
https://xx.xx.xx.xx:9440CREDENTIALS: Choose a pre-stored username/password credential set or enter a username/password set. If entering the credentials locally, you may also choose to securely store the credentials for later use. Depending on selection, additional fields will be added to facilitate that choice
API VERSION: Select the API version supported by your Nutanix environment to ensure Morpheus is not targeting endpoints which are incompatible with your environment
INVENTORY EXISTING INSTANCES: When checked, Morpheus will automatically onboard workloads which are already running in the Nutanix environment but which were provisioned outside of Morpheus. These may be brought under Morpheus management at a later time, if desired
ENABLE HYPERVISOR CONSOLE: When checked, enables remote console support directly to the hypervisor
In addition to these basic settings, there are also some advanced options. These are similar but not identical for every Cloud type and some of them may not appear for Nutanix Clouds.
Advanced Cloud Options
Advanced Options
- DOMAIN
Specify a default domain for instances provisioned to this Cloud.
- SCALE PRIORITY
Only affects Docker Provisioning. Specifies the priority with which an instance will scale into the cloud. A lower priority number means this cloud integration will take scale precedence over other cloud integrations in the group.
- APPLIANCE URL
Alternate Appliance url for scenarios when the default Appliance URL (configured in admin > settings) is not reachable or resolvable for Instances provisioned in this cloud. The Appliance URL is used for Agent install and reporting.
- TIME ZONE
Configures the time zone on provisioned VM’s if necessary.
- DATACENTER ID
Used for differentiating pricing among multiple datacenters. Leave blank unless prices are properly configured.
- NETWORK MODE
Unmanaged or select a Network Integration (NSX, ACI etc)
- LOCAL FIREWALL
On or Off. Enable to managed Host and VM firewall/IP Table rules (linux only)
- SECURITY SERVER
Security Server setting is for Security Service Integrations such as ACI
- TRUST PROVIDER
Select Internal (Morpheus) or an existing Trust Provider Integration
- STORAGE MODE
Single Disk, LVM or Clustered
- BACKUP PROVIDER
Select a backup provider. Depending on the Cloud type and any currently-configured backup plugins you may select Internal Backups (Morpheus) or another configured backup solution
- REPLICATION PROVIDER
Sets the default Replication Provider for the Cloud. Select an existing Replication Provider Integration
- GUIDANCE
Enable Guidance recommendations on cloud resources.
- COSTING
Enable for Morpheus to sync Costing data from the Cloud provider, when available. For on-prem Clouds, enabling costing activates a costing service designed to mirror the live costing experience of public clouds, including invoicing with line items and real-time cost data (Operations > Costing > Invoices). If your organization utilizes reserved instances and you want to pull in related pricing data, some Cloud integrations include the option to select Costing and Reservations. If this is not relevant, select Costing to save money on additional calls to the Cloud provider’s costing API.
- DNS INTEGRATION
Records for instances provisioned in this cloud will be added to selected DNS integration.
- SERVICE REGISTRY
Services for instances provisioned in this cloud will be added to selected Service Registry integration.
- CONFIG MANAGEMENT
Select a Chef, Ansible or Puppet integration to be used with this Cloud.
- CMDB
Select CMDB Integration to automatically update selected CMDB.
- CMDB DISCOVERY
When checked, any automatically discovered (unmanaged) servers onboarded into Morpheus from this Cloud will also have CMDB records created for them.
- CHANGE MANAGEMENT
Select an existing Change Management Integration to set on the Cloud. ex: Cherwell
- AGENT INSTALL MODE
SSH / WINRM / Guest Execution: Morpheus will attempt to use SSH, WINRM or Guest Execution for Agent install.
Cloud Init / Unattend (when available): (DEFAULT) Morpheus will utilize Cloud-Init or Cloudbase-Init for agent install when provisioning images with Cloud-Init/Cloudbase-Init installed. Morpheus will fall back on SSH or WINRM if cloud-init is not installed on the provisioned image. Morpheus will also add Agent installation to Windows unattend.xml data when performing Guest Customizations or utilizing syspreped images.
- VDI GATEWAY
Set a VDI Gateway for outbound communication from the Morpheus Appliance to the vdi endpoints. VDI Gateways can be added in
/tools/vdi/gateways
CUSTOM LOGOS
When integrating a Cloud, it will appear by default throughout the UI with its standard logo (VMware logo for VMware Clouds, etc.). If desired, you may upload a custom logo that should appear instead. This might be useful for MSPs which might not want to reveal the Cloud type underlying its services. A dark mode version of the logo may also be uploaded if the standard logo doesn’t look right against the Morpheus dark mode theme. Checking USE DEFAULT CLOUD LOGOS allows the user to return to the standard logo for the Cloud type without deleting the custom uploaded logo.
INVENTORY OPTIONS
Inventory options allow you to set a default active or inactive state for certain discovered resources. The list of available resources to configure will vary based on the Cloud type and its supported resources. By default, all possible resources for the Cloud type will be discovered in an active state. Uncheck the box for some or all resources to discover them in an inactive state. The list of potential resources that may appear include:
Service Plans
Resource Pools
Networks
Security Groups
Datastores
Folders
Provisioning Command
- PROXY
Set a proxy for inbound communication from Instances to the Morpheus Appliance. Proxies can be added in the Infrastructure > Networks > Proxies tab.
- Bypass Proxy for Appliance URL
Enable to bypass proxy settings (if added) for Morpheus Agent communication to the Appliance URL.
- NO PROXY
Include a list of IP addresses or name servers to exclude from proxy traversal
- USER DATA (LINUX)
Add cloud-init user data. Morpheus 4.1.0 and earlier assumes bash syntax. Morpheus 4.1.1 and later supports all User Data formats. Refer to https://cloudinit.readthedocs.io/en/latest/topics/format.html for more information.
With the above configurations made, click NEXT. Choose to add the Cloud to an existing Group or to create a new Group and click NEXT once again. Finally, review the details of the new Cloud on the REVIEW tab and click COMPLETE if all looks good. At this point the new Cloud will be added to Morpheus and the initial Cloud sync will begin. On the Cloud list page (Infrastructure > Clouds), we will see the Cloud in an “OK” status once it is ready to be consumed in Morpheus as a provisioning target. Click into the Cloud detail page by clicking on the NAME of the Cloud from the list. Continue on to the next section for an overview of the details available on the Cloud detail.
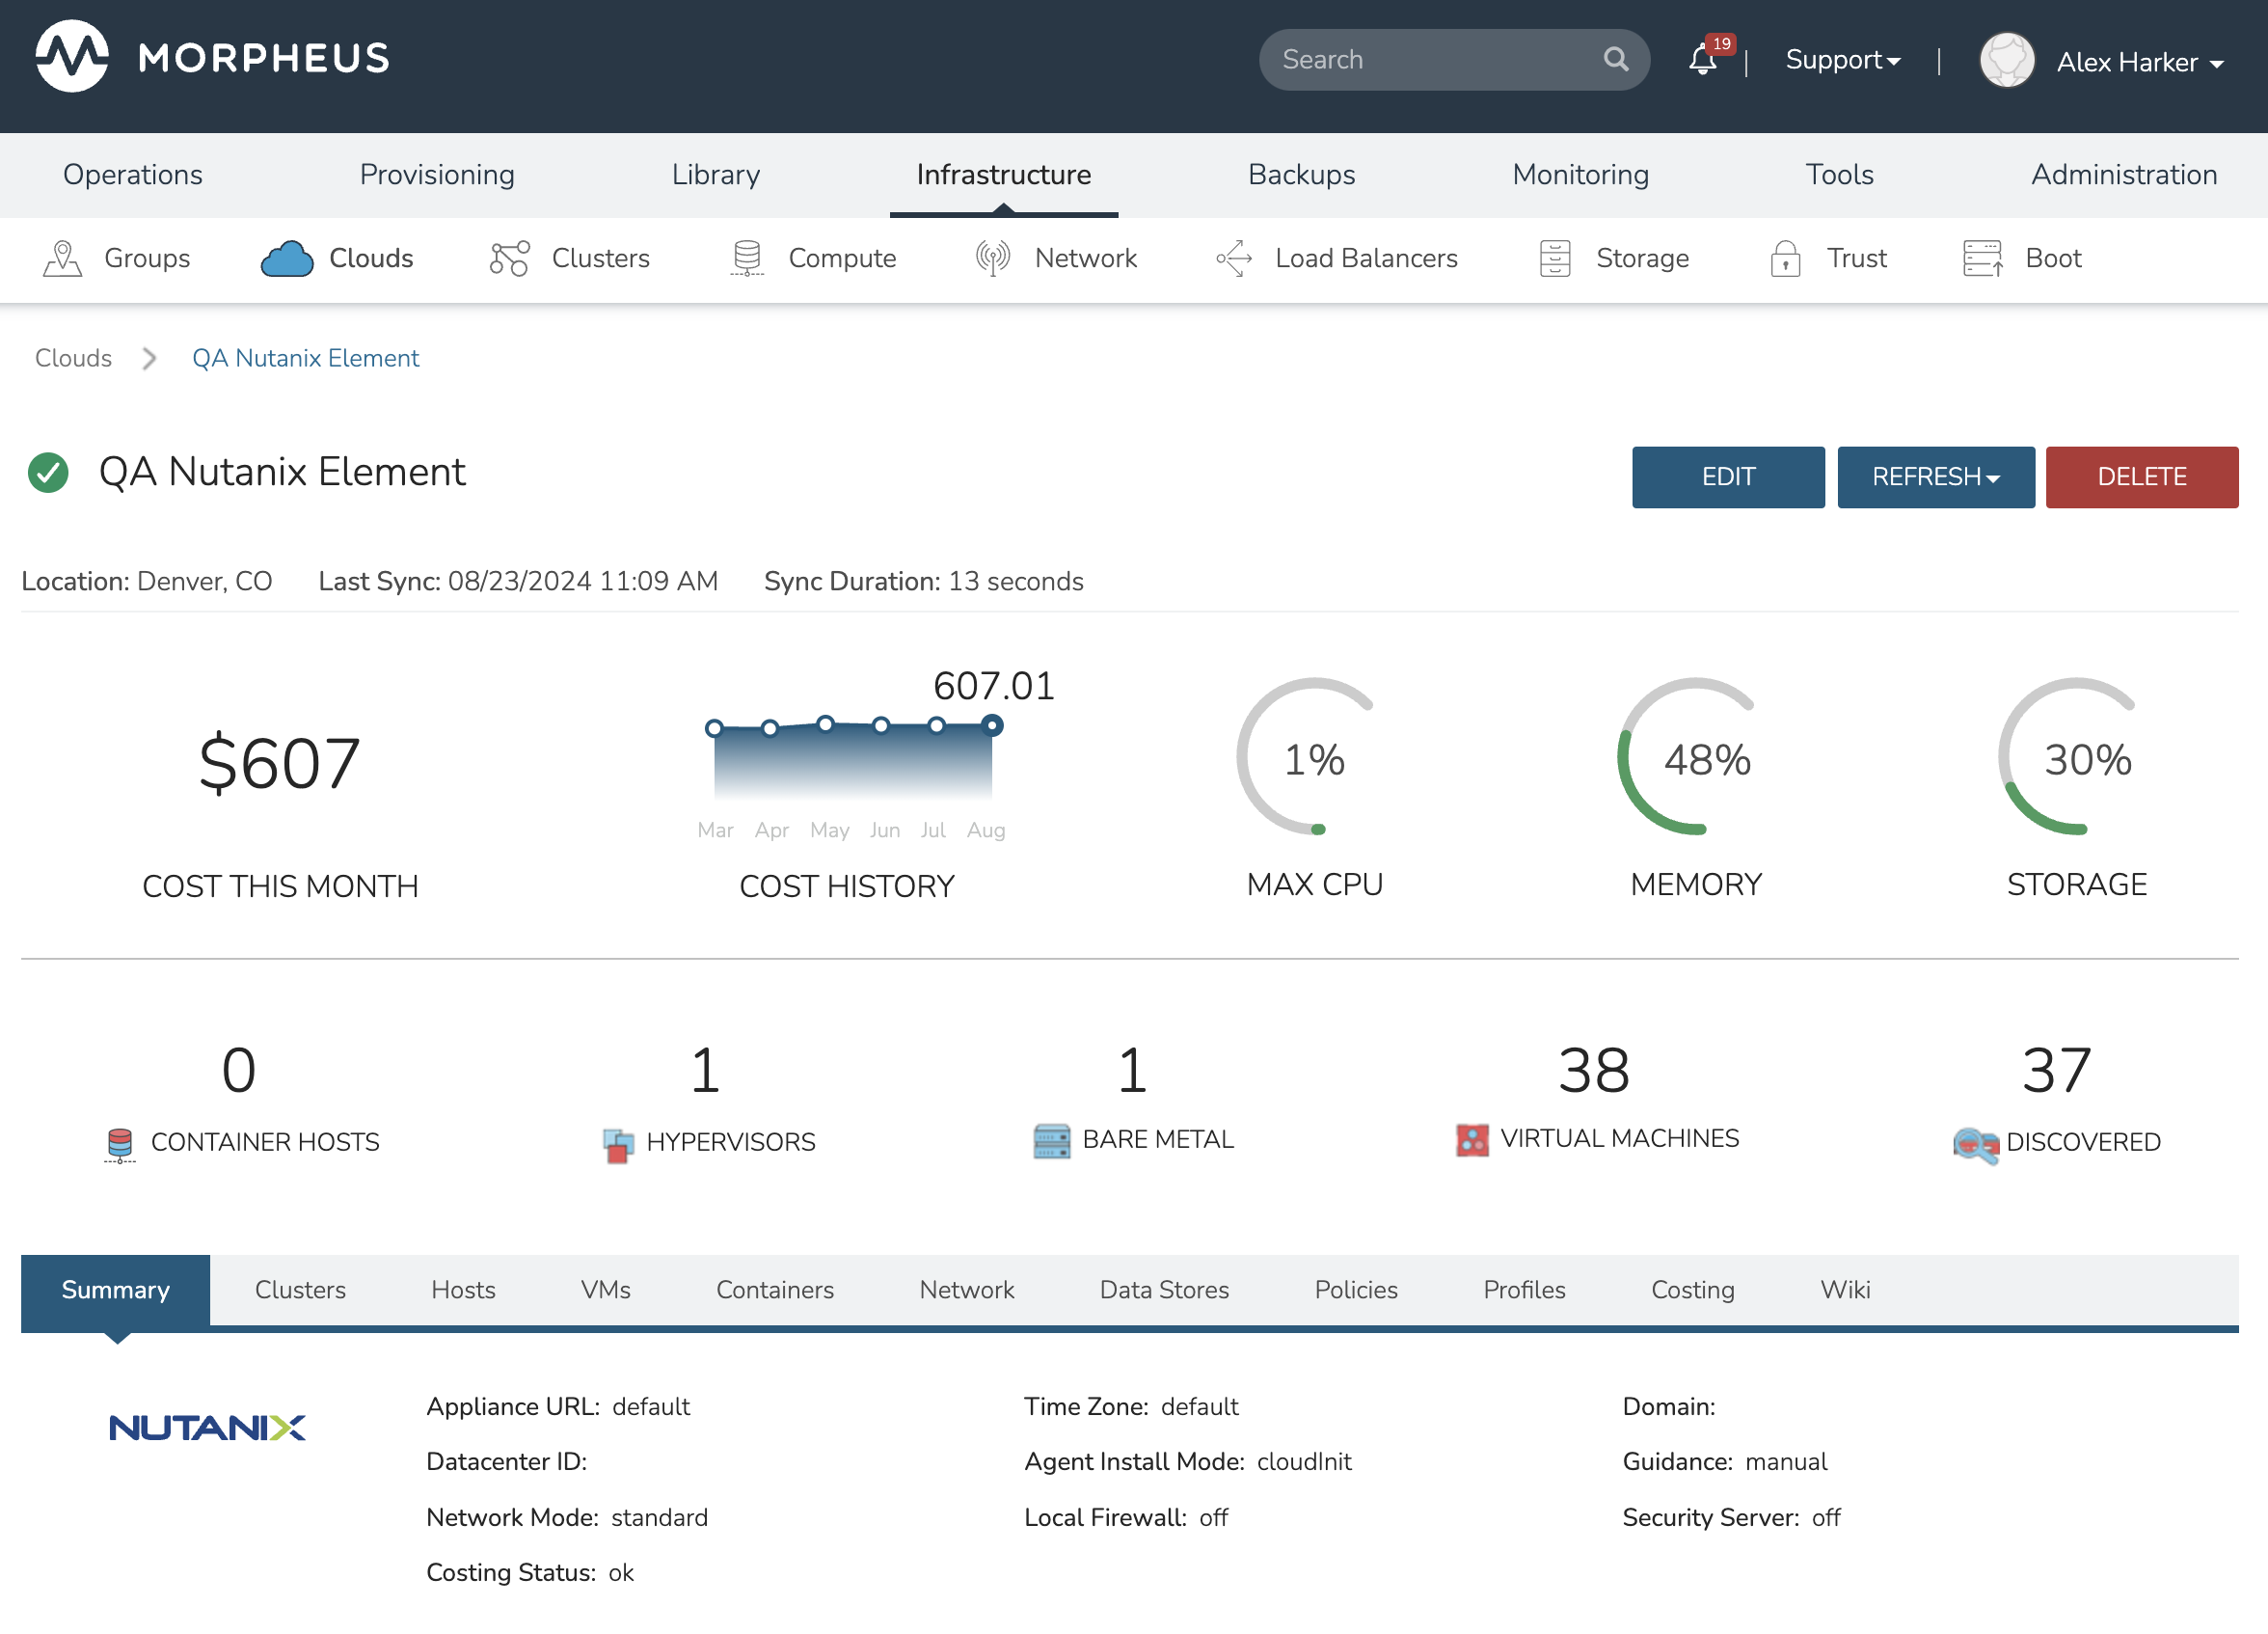
Monitoring Nutanix Clouds
On clicking into the Nutanix Cloud, you’ll land on the Summary tab. Here we can see high-level details including cost metrics for the month, general resource utilization information, and information on the number of hosts, workloads, and more that are currently running within the Cloud scope.
You’ll also notice the Clusters tab. Here you can see and click into any Docker or Kubernetes Clusters which are running on the Nutanix Cloud. Morpheus will see these clusters as provisioning targets themselves for containerized applications (as opposed to the Cloud itself for virtualized applications). You can also add new Kubernetes or Dockers clusters from this tab. Morpheus includes built-in Cluster Layouts but custom Cluster Layouts can also be created. There is a guide on creating your own custom Kubernetes Cluster Layouts in the Clusters section of Morpheus UI documentation.
On the Hosts tab, you’ll see all Nutanix hypervisior hosts which are associated with the cluster. Host health metrics are viewable and we can click into individual hosts to see even greater detail on the individual host detail pages.
The VM and Containers tabs show all current VM and container workloads across the cluster. When integrating the Cloud, if you opted to inventory existing workloads, discovered resources will appear here. If not (or if there simply are none), only Morpheus-provisioned workloads will appear here.
Provisioning New Workloads
With the Cloud integrated, you’re already to provision new workloads. Morpheus comes pre-installed with a number of default library items designed to work with each supported Cloud integration type, including Nutanix. While this guide will not go through the process of using the provisioning wizard (see Provisioning > Instances page to start), you could provision a default workload to test functionality now if desired. Additionally, Morpheus will sync Virtual Images from Nutanix Clouds (Library > Virtual Images) and custom Library items may be built from these images. See the Library section of Morpheus documentation for more information on piecing together Instance Types, images, and automation scripts into cohesive and easily-consumed Library items.
Service Plans
Morpheus includes a default set of Service Plans. These Service Plans can be considered akin to AWS Flavors or Openstack Flavors. They provide a means to set predefined tiers on memory, storage, and CPU cores. Price tables can also be applied to these so estimated cost per virtual machine can be tracked as well as pricing for customers. By default, these options are fixed sizes but can be configured for dynamic sizing. A service plan can be configured to allow a custom user entry for memory, storage, or cpu. To configure this, simply edit an existing Service Plan tied to Nutanix or create a new one. These all can be easily managed from the Administration > Plans & Pricing section.
Docker
So far, this document has covered how to add the Nutanix cloud integration and has enabled users the ability to provision virtual machine-based Instances. Another great feature provided by Morpheus out of the box is the ability to use Docker containers and even support multiple containers per Docker host. To do this, a Docker Host must first be provisioned into Nutanix (multiple are needed when dealing with horizontal scaling scenarios). As mentioned previously, these can be viewed or created from the Clusters tab of the Cloud detail page.
To provision a Docker Host, simply navigate to the Cloud detail page or Infrastructure > Clusters section. From there, click + ADD CLUSTER to add a Nutanix Docker Host. Morpheus views a Docker host just like any other Hypervisor with the caveat being that it is used for running containerized images instead of virtualized ones. Once a Docker Host is successfully provisioned, a green checkmark will appear to the right of the host marking it as available for use. In the event of a failure, click into the relevant host that failed and an error explaining the failure will be displayed in red at the top. Just like with VMs, Morpheus includes default containerized items out of the box so provisioning to Docker hosts can be tested even before you’ve created your own container-based Library items.
Some common error scenarios include network connectivity. For a Docker Host to function properly, it must be able to resolve the Morpheus appliance URL which can be configured in Administration > Settings. If it is unable to resolve and negotiate with the appliance, then the Agent installation will fail and provisioning instructions will not be able to be issued to the host.
Snapshots
Morpheus allows the ability to create a snapshot of a Nutanix Instance. From the Instance detail page, simply select Actions > Create Snapshot to begin creation of a new Snapshot. Existing snapshots can be viewed in the BACKUPS tab on the Instance detail page. Snapshots taken outside Morpheus will be synced every five minutes (by default). To revert to a previous snapshot, click on the revert icon located on the right side of the Snapshot. Snapshots can be deleted by clicking on the trash can icon.
Note
Access to Snapshots can be limited or removed entirely for specific user roles as needed. To edit a role’s Snapshots permissions, go to Administration > Roles > (Your selected role) > Snapshots. Users can be given Full, Read-only, or No access.